

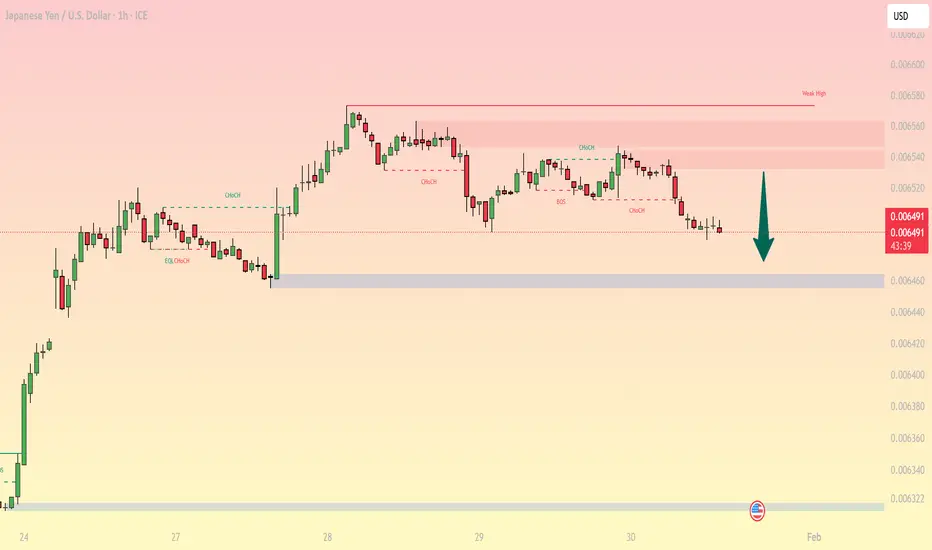
JPYUSD 1H Outlook: Bearish Shift After Repeated CHoCH, Focus on Sell-Rallies Into Supply
JPYUSD on the 1H chart is showing a clear loss of bullish momentum after multiple CHoCH signals and a failure to reclaim the prior “weak high” area. Price is now compressing under intraday resistance and drifting toward a clearly defined demand zone around 0.00646–0.00647. Until buyers can break back above the supply bands, the higher-probability play is to treat pullbacks as shorting opportunities.

1H Market Structure and Price Action
The earlier uptrend created a visible “weak high” near the 0.00657–0.00658 region, followed by distribution.
Multiple CHoCH/BOS markings highlight that buyers are no longer protecting higher lows consistently.
Current candles are printing a soft base around 0.00649, but the structure still favors a push into lower liquidity (the demand band below).
Key Support and Resistance Levels (Intraday)
Resistance (Sell Zone / Supply)
0.00653–0.00656: Main supply band where price repeatedly rejected.
0.00657–0.00658: Weak high liquidity line (sweep risk, then reversal).
Support (Buyers Must Defend)
0.00649–0.00650: Current pivot (intraday decision point).
0.00646–0.00647: Demand zone (primary downside magnet).
0.00640 then 0.00632: Deeper supports if 0.00646 fails (next liquidity shelves).
Fibonacci Map for Sell-Rally Planning
Using the most recent downswing (approx. 0.00654 high → 0.00649 low), key retracement levels to watch:
0.382: ~0.006509
0.5: ~0.006515
0.618: ~0.006521
0.786: ~0.006529
Confluence improves when these Fibonacci levels overlap with the 0.00653–0.00656 supply band and a clean rejection wick.
EMA and RSI Filters (Execution Rules)
To keep entries disciplined, use these as confirmation rather than prediction:
EMA filter: Prefer shorts when price is below EMA50/EMA200 and EMA20 is turning down under EMA50.
RSI filter: Shorts are higher quality when RSI is below 50 and fails to reclaim 50 on pullback; bullish reversal attempts strengthen only if RSI reclaims 50 and holds.
High-Probability Trading Setups for Today (JPYUSD Intraday)
Strategy A: Sell the Pullback Into Supply (Primary Plan)
Bias: Bearish continuation
Entry idea: Wait for price to retrace into 0.00652–0.00656 (Fib 0.618–0.786 region) and print a rejection (bearish engulfing, long upper wick, or a lower-high structure).
Entry: 0.00652–0.00655 after rejection confirmation
Stop loss: Above 0.00657–0.00658 (above weak high liquidity)
Take profit 1: 0.00649–0.00650
Take profit 2: 0.00646–0.00647 demand zone
Best condition: EMA structure bearish, RSI fails below 50.
Strategy B: Breakdown + Retest (Momentum Plan)
Bias: Bearish continuation with confirmation
If 0.00649 breaks decisively (1H close below) and price retests that level as resistance:
Entry: Sell the retest of 0.00649–0.00650
Stop loss: Above the retest swing high (tight, technical)
Take profit: 0.00646–0.00647 first, then trail if momentum expands toward 0.00640
Why it works: You let the market prove weakness first, then enter on a cleaner risk-to-reward structure.
Strategy C: Countertrend Bounce From Demand (Lower Priority, Fast In/Out)
This is not the main bias, but it can work if the demand zone holds strongly.
Entry: Buy only after a clear hold at 0.00646–0.00647 (rejection wick + shift to higher low on lower timeframe)
Stop loss: Below the demand zone base
Take profit: Back to 0.00649–0.00650, then 0.00652 if momentum builds
Rule: If price slices through 0.00646 without reaction, do not force longs.
Invalidation and What Would Flip Bullish
The bearish thesis weakens if JPYUSD reclaims the 0.00653–0.00656 supply band and holds above it (especially if RSI holds above 50 and price starts building higher lows). A clean break and hold above the weak high area near 0.00657–0.00658 would be a stronger bullish confirmation.
Risk Notes
Intraday setups work best when you size positions so the stop loss is fully acceptable. Avoid chasing candles in the middle of the range; let price come to your levels and confirm with structure.
JPYUSD on the 1H chart is showing a clear loss of bullish momentum after multiple CHoCH signals and a failure to reclaim the prior “weak high” area. Price is now compressing under intraday resistance and drifting toward a clearly defined demand zone around 0.00646–0.00647. Until buyers can break back above the supply bands, the higher-probability play is to treat pullbacks as shorting opportunities.
1H Market Structure and Price Action
The earlier uptrend created a visible “weak high” near the 0.00657–0.00658 region, followed by distribution.
Multiple CHoCH/BOS markings highlight that buyers are no longer protecting higher lows consistently.
Current candles are printing a soft base around 0.00649, but the structure still favors a push into lower liquidity (the demand band below).
Key Support and Resistance Levels (Intraday)
Resistance (Sell Zone / Supply)
0.00653–0.00656: Main supply band where price repeatedly rejected.
0.00657–0.00658: Weak high liquidity line (sweep risk, then reversal).
Support (Buyers Must Defend)
0.00649–0.00650: Current pivot (intraday decision point).
0.00646–0.00647: Demand zone (primary downside magnet).
0.00640 then 0.00632: Deeper supports if 0.00646 fails (next liquidity shelves).
Fibonacci Map for Sell-Rally Planning
Using the most recent downswing (approx. 0.00654 high → 0.00649 low), key retracement levels to watch:
0.382: ~0.006509
0.5: ~0.006515
0.618: ~0.006521
0.786: ~0.006529
Confluence improves when these Fibonacci levels overlap with the 0.00653–0.00656 supply band and a clean rejection wick.
EMA and RSI Filters (Execution Rules)
To keep entries disciplined, use these as confirmation rather than prediction:
EMA filter: Prefer shorts when price is below EMA50/EMA200 and EMA20 is turning down under EMA50.
RSI filter: Shorts are higher quality when RSI is below 50 and fails to reclaim 50 on pullback; bullish reversal attempts strengthen only if RSI reclaims 50 and holds.
High-Probability Trading Setups for Today (JPYUSD Intraday)
Strategy A: Sell the Pullback Into Supply (Primary Plan)
Bias: Bearish continuation
Entry idea: Wait for price to retrace into 0.00652–0.00656 (Fib 0.618–0.786 region) and print a rejection (bearish engulfing, long upper wick, or a lower-high structure).
Entry: 0.00652–0.00655 after rejection confirmation
Stop loss: Above 0.00657–0.00658 (above weak high liquidity)
Take profit 1: 0.00649–0.00650
Take profit 2: 0.00646–0.00647 demand zone
Best condition: EMA structure bearish, RSI fails below 50.
Strategy B: Breakdown + Retest (Momentum Plan)
Bias: Bearish continuation with confirmation
If 0.00649 breaks decisively (1H close below) and price retests that level as resistance:
Entry: Sell the retest of 0.00649–0.00650
Stop loss: Above the retest swing high (tight, technical)
Take profit: 0.00646–0.00647 first, then trail if momentum expands toward 0.00640
Why it works: You let the market prove weakness first, then enter on a cleaner risk-to-reward structure.
Strategy C: Countertrend Bounce From Demand (Lower Priority, Fast In/Out)
This is not the main bias, but it can work if the demand zone holds strongly.
Entry: Buy only after a clear hold at 0.00646–0.00647 (rejection wick + shift to higher low on lower timeframe)
Stop loss: Below the demand zone base
Take profit: Back to 0.00649–0.00650, then 0.00652 if momentum builds
Rule: If price slices through 0.00646 without reaction, do not force longs.
Invalidation and What Would Flip Bullish
The bearish thesis weakens if JPYUSD reclaims the 0.00653–0.00656 supply band and holds above it (especially if RSI holds above 50 and price starts building higher lows). A clean break and hold above the weak high area near 0.00657–0.00658 would be a stronger bullish confirmation.
Risk Notes
Intraday setups work best when you size positions so the stop loss is fully acceptable. Avoid chasing candles in the middle of the range; let price come to your levels and confirm with structure.

🪙 JOIN OUR FREE TELEGRAM GROUP 🪙
t.me/dnaprofits
Join the community group to get support and share knowledge!
️🥇 Exchange and learn market knowledge
️🥇 Support free trading signals
t.me/dnaprofits
Join the community group to get support and share knowledge!
️🥇 Exchange and learn market knowledge
️🥇 Support free trading signals
إخلاء المسؤولية
لا يُقصد بالمعلومات والمنشورات أن تكون، أو تشكل، أي نصيحة مالية أو استثمارية أو تجارية أو أنواع أخرى من النصائح أو التوصيات المقدمة أو المعتمدة من TradingView. اقرأ المزيد في شروط الاستخدام.
🪙 JOIN OUR FREE TELEGRAM GROUP 🪙
t.me/dnaprofits
Join the community group to get support and share knowledge!
️🥇 Exchange and learn market knowledge
️🥇 Support free trading signals
t.me/dnaprofits
Join the community group to get support and share knowledge!
️🥇 Exchange and learn market knowledge
️🥇 Support free trading signals
إخلاء المسؤولية
لا يُقصد بالمعلومات والمنشورات أن تكون، أو تشكل، أي نصيحة مالية أو استثمارية أو تجارية أو أنواع أخرى من النصائح أو التوصيات المقدمة أو المعتمدة من TradingView. اقرأ المزيد في شروط الاستخدام.