
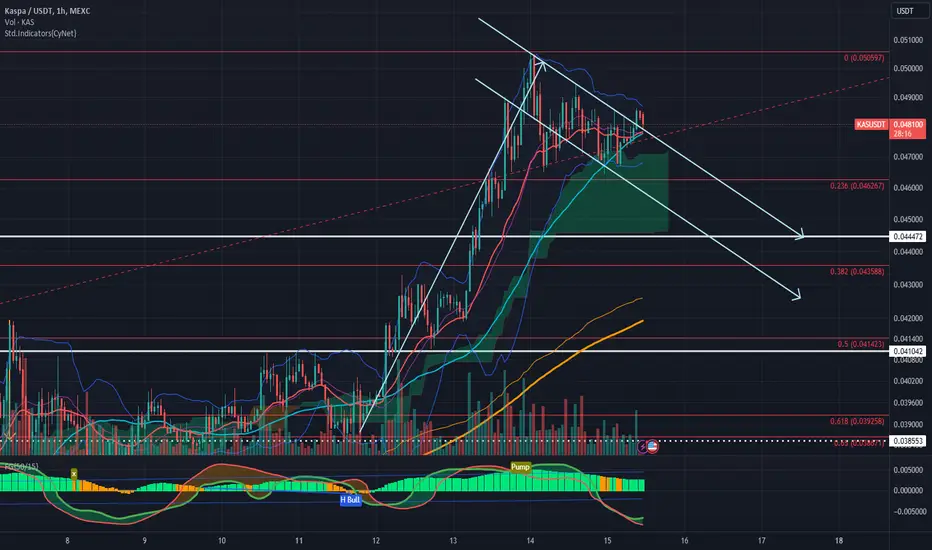
Waiting for retest confirmation on the hourly, and the 4 hrly.
ملاحظة
Next measured move at ca. 6.2 cents.ملاحظة
A previously posted longer-term AB=CD measured target @ ~0.12 cents:ملاحظة
Breakout confirmed on the hourly:ملاحظة
Typo for the above:Wrote "0.12 cents when I meant 0.12 USD" for the longer-term AB=CD measured move target.
ملاحظة
Bounced off the top of the flag as support. Bullish perspective still remains valid.ملاحظة
Potential inverse head-and-shoulder forming?ملاحظة
Summary consolidated view of the charts presented thus far:KAS remained above the downward sloppy line (of what was previously perceived to be a potential bull flag formation) even after the current dump and then bounced strongly off of it -- hence still above support. Didn't pump directly from what can be considered bull-flag early but that is good (even more bullish in fact), since this retrace would have gotten rid of all the weak-hands who do not understand that KAS still remains undervalued even at the present price range close to its ATH.
I believe KAS will come down to 0.046 USD for a final time before breaking ATH (this inverse head and shoulder thing, which simply indicates a momentum reversal).
Time to FOMO if it breaks and closes above ATH for the blue skies above; and will definitely buy if it drops down again towards the 0.046 USD target.
ملاحظة
KASPA need to pierce and find support above the red 21 EMA line before a bullish continuation can occur. Continuation down to 0.041 USD is likely if rejected by the 21 EMA. The green line is the 50 SMA.ملاحظة
Hourly Chart perspective. Thick orange line is the 200 SMA, thin orange line is the 200 VWMA. Green line is the 50 SMA. KAS have now fallen below the 200 SMA which coincides close to the present 50 SMA on the 4 hrly.ملاحظة
Hourly chart watch.Waiting to see if KAS will break out above the 200 SMA on the hourly (first sign of a reversal towards bullishness, and then to refer to the 4hrly chart); or fall to the green box area where I might start DCAing again.
ملاحظة
Here's the Chart that I had neglected to include in the post just above:
منشورات ذات صلة
إخلاء المسؤولية
لا يُقصد بالمعلومات والمنشورات أن تكون، أو تشكل، أي نصيحة مالية أو استثمارية أو تجارية أو أنواع أخرى من النصائح أو التوصيات المقدمة أو المعتمدة من TradingView. اقرأ المزيد في شروط الاستخدام.
منشورات ذات صلة
إخلاء المسؤولية
لا يُقصد بالمعلومات والمنشورات أن تكون، أو تشكل، أي نصيحة مالية أو استثمارية أو تجارية أو أنواع أخرى من النصائح أو التوصيات المقدمة أو المعتمدة من TradingView. اقرأ المزيد في شروط الاستخدام.