
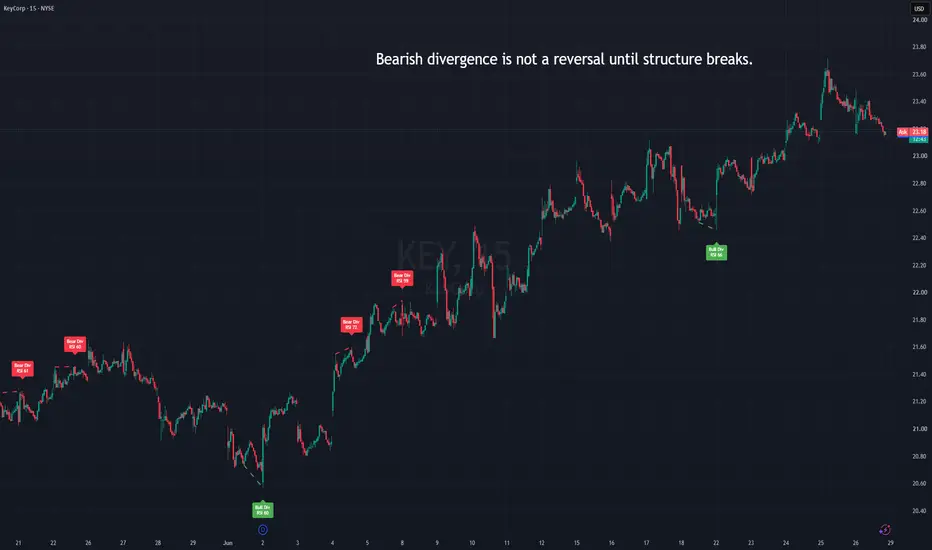
RSI divergence is useful, but it is often misunderstood.
Many traders see bearish divergence and immediately expect a reversal. The problem is that divergence does not mean price must reverse. It only means that momentum is no longer confirming the latest price move.
In a strong trend, this can happen several times before price actually changes direction.
What bearish RSI divergence shows
Bearish RSI divergence appears when:
– price makes a higher high
– RSI makes a lower high
This means upside momentum is weaker compared with the previous swing.
But weaker momentum is not the same as a confirmed trend reversal.
A strong trend can continue even while bearish RSI divergence appears.
Why divergence can fail
Most failed divergence signals happen because traders ignore the broader price structure.
For example:
– price continues forming higher lows
– pullbacks are quickly bought
– the broader trend remains intact
– volume does not confirm a reversal
– there is no clear breakdown after the divergence
In that environment, bearish divergence may only show temporary exhaustion, not a full reversal.
How I read it
I treat RSI divergence as a warning layer.
It tells me:
– momentum may be cooling
– the move may be stretched
– chasing new long entries may be riskier
– a pause or pullback may become more likely
But I do not treat it as an automatic short signal.
For bearish divergence to become more important, I want to see additional confirmation:
– price loses structure
– lower highs start forming
– an important support area breaks
– the next bounce is weak
– selling pressure follows through
Without that confirmation, divergence can remain only a warning.
Main idea
RSI divergence shows momentum disagreement.
Price structure shows whether that disagreement matters.
This is why divergence should not be used alone. It works best as part of a broader process that includes trend, structure, volume context and risk management.
Educational content only. Not financial advice.
Many traders see bearish divergence and immediately expect a reversal. The problem is that divergence does not mean price must reverse. It only means that momentum is no longer confirming the latest price move.
In a strong trend, this can happen several times before price actually changes direction.
What bearish RSI divergence shows
Bearish RSI divergence appears when:
– price makes a higher high
– RSI makes a lower high
This means upside momentum is weaker compared with the previous swing.
But weaker momentum is not the same as a confirmed trend reversal.
A strong trend can continue even while bearish RSI divergence appears.
Why divergence can fail
Most failed divergence signals happen because traders ignore the broader price structure.
For example:
– price continues forming higher lows
– pullbacks are quickly bought
– the broader trend remains intact
– volume does not confirm a reversal
– there is no clear breakdown after the divergence
In that environment, bearish divergence may only show temporary exhaustion, not a full reversal.
How I read it
I treat RSI divergence as a warning layer.
It tells me:
– momentum may be cooling
– the move may be stretched
– chasing new long entries may be riskier
– a pause or pullback may become more likely
But I do not treat it as an automatic short signal.
For bearish divergence to become more important, I want to see additional confirmation:
– price loses structure
– lower highs start forming
– an important support area breaks
– the next bounce is weak
– selling pressure follows through
Without that confirmation, divergence can remain only a warning.
Main idea
RSI divergence shows momentum disagreement.
Price structure shows whether that disagreement matters.
This is why divergence should not be used alone. It works best as part of a broader process that includes trend, structure, volume context and risk management.
Educational content only. Not financial advice.

US stocks · RSI divergence + EMA structure tools
Custom Pine Script indicators, alerts & dashboards
Development & tools: benefitman.netlify.app
Educational only. Not financial advice.
Custom Pine Script indicators, alerts & dashboards
Development & tools: benefitman.netlify.app
Educational only. Not financial advice.
إخلاء المسؤولية
لا يُقصد بالمعلومات والمنشورات أن تكون، أو تشكل، أي نصيحة مالية أو استثمارية أو تجارية أو أنواع أخرى من النصائح أو التوصيات المقدمة أو المعتمدة من TradingView. اقرأ المزيد في شروط الاستخدام.
US stocks · RSI divergence + EMA structure tools
Custom Pine Script indicators, alerts & dashboards
Development & tools: benefitman.netlify.app
Educational only. Not financial advice.
Custom Pine Script indicators, alerts & dashboards
Development & tools: benefitman.netlify.app
Educational only. Not financial advice.
إخلاء المسؤولية
لا يُقصد بالمعلومات والمنشورات أن تكون، أو تشكل، أي نصيحة مالية أو استثمارية أو تجارية أو أنواع أخرى من النصائح أو التوصيات المقدمة أو المعتمدة من TradingView. اقرأ المزيد في شروط الاستخدام.