
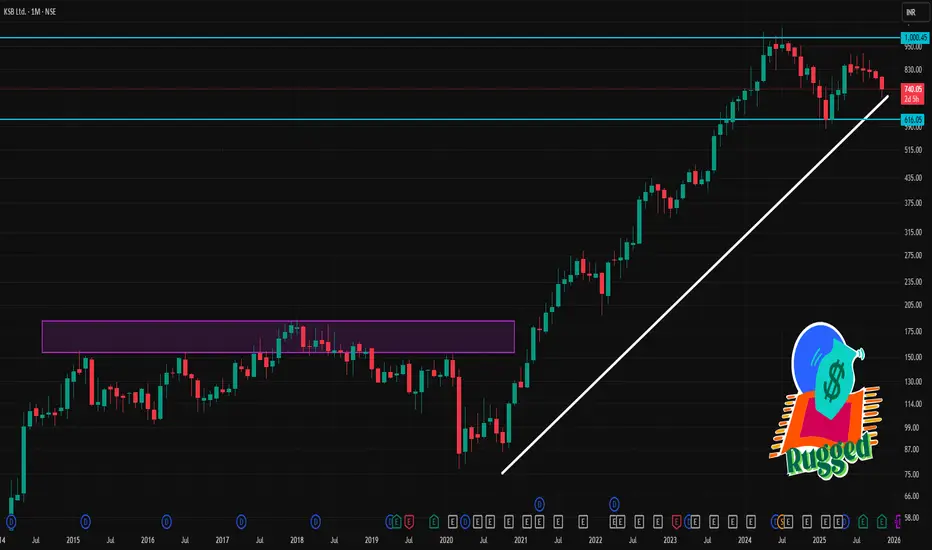
📊 Recent Price & Context
1. As of this week, KSB share price is trading around ₹ 740–748.
2. Over the past 1 month, the stock has seen a decline: some data suggest ~–10% to –12% monthly movement.
3. 52-week trading range: ~₹ 582 (low) to ~₹ 912 (high).
⭐ What this implies (1-Month Outlook)
Base case (neutral / consolidation): Price may hover between ₹ 702–750, possibly swinging around support-resistance zones if broader markets remain stable.
Bullish near-term bounce: If sentiment or fundamentals improve (orders, demand, sector enthusiasm), KSB could test ₹ 738–750 — a key resistance cluster.
Bearish downside: Weak macro or sector headwinds might push price toward ₹ 690, or — if broken — towards ₹ 678.
1. As of this week, KSB share price is trading around ₹ 740–748.
2. Over the past 1 month, the stock has seen a decline: some data suggest ~–10% to –12% monthly movement.
3. 52-week trading range: ~₹ 582 (low) to ~₹ 912 (high).
⭐ What this implies (1-Month Outlook)
Base case (neutral / consolidation): Price may hover between ₹ 702–750, possibly swinging around support-resistance zones if broader markets remain stable.
Bullish near-term bounce: If sentiment or fundamentals improve (orders, demand, sector enthusiasm), KSB could test ₹ 738–750 — a key resistance cluster.
Bearish downside: Weak macro or sector headwinds might push price toward ₹ 690, or — if broken — towards ₹ 678.

Contact Knowledgehub for a detailed consultation: Dm on WhatsApp: [wa.link/a2o0kz]-
Phone No: [+91 93102 26243]-
Email: [tradingviewknowledgehub@gmail.com]---
-- Let’s achieve success together!
Phone No: [+91 93102 26243]-
Email: [tradingviewknowledgehub@gmail.com]---
-- Let’s achieve success together!
منشورات ذات صلة
إخلاء المسؤولية
لا يُقصد بالمعلومات والمنشورات أن تكون، أو تشكل، أي نصيحة مالية أو استثمارية أو تجارية أو أنواع أخرى من النصائح أو التوصيات المقدمة أو المعتمدة من TradingView. اقرأ المزيد في شروط الاستخدام.
Contact Knowledgehub for a detailed consultation: Dm on WhatsApp: [wa.link/a2o0kz]-
Phone No: [+91 93102 26243]-
Email: [tradingviewknowledgehub@gmail.com]---
-- Let’s achieve success together!
Phone No: [+91 93102 26243]-
Email: [tradingviewknowledgehub@gmail.com]---
-- Let’s achieve success together!
منشورات ذات صلة
إخلاء المسؤولية
لا يُقصد بالمعلومات والمنشورات أن تكون، أو تشكل، أي نصيحة مالية أو استثمارية أو تجارية أو أنواع أخرى من النصائح أو التوصيات المقدمة أو المعتمدة من TradingView. اقرأ المزيد في شروط الاستخدام.