
Technical Analysis: PSX Index (KSE-100) – 1-Hour Timeframe
By The Chart Alchemist
---
Market Structure Overview
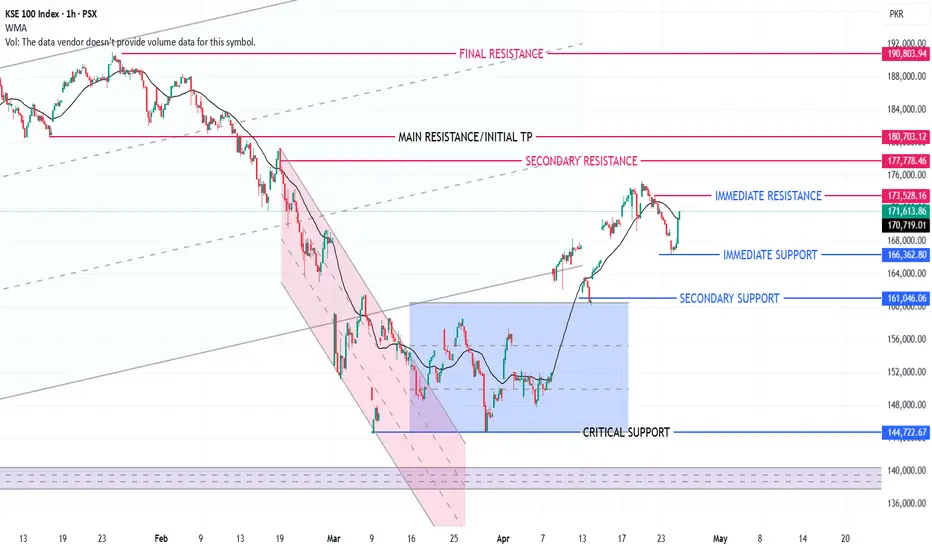
After reaching its all-time high, the index entered a bearish correction, with the latter phase confined within a defined bearish channel (light pink). This was followed by a lateral consolidation phase forming a horizontal range (light blue), characteristic of a Wyckoff accumulation structure.
---
Breakout & Trend Development
The index has successfully broken out of the accumulation range, signaling a structural shift toward bullish continuation. Price action has already completed two impulsive upward legs, and one additional push to the upside is anticipated before any significant correction.
---
Upside Projection
The ongoing bullish leg is expected to extend toward the primary oblique resistance, which also serves as the initial target at:
180,700 points
---
Support Levels
Immediate Support: 166,360
Secondary Support: 161,000
Critical Support: 144,700
---
Resistance Levels
Immediate Resistance: 171,600
Secondary Resistance: 177,780
Main Resistance / Initial Target: 180,700
Final Resistance: 190,800
---
Conclusion
The index maintains a bullish bias on the 1-hour timeframe, with strong potential for further upside continuation toward the 180,700 level before any major corrective phase develops.
By The Chart Alchemist
---
Market Structure Overview
After reaching its all-time high, the index entered a bearish correction, with the latter phase confined within a defined bearish channel (light pink). This was followed by a lateral consolidation phase forming a horizontal range (light blue), characteristic of a Wyckoff accumulation structure.
---
Breakout & Trend Development
The index has successfully broken out of the accumulation range, signaling a structural shift toward bullish continuation. Price action has already completed two impulsive upward legs, and one additional push to the upside is anticipated before any significant correction.
---
Upside Projection
The ongoing bullish leg is expected to extend toward the primary oblique resistance, which also serves as the initial target at:
180,700 points
---
Support Levels
Immediate Support: 166,360
Secondary Support: 161,000
Critical Support: 144,700
---
Resistance Levels
Immediate Resistance: 171,600
Secondary Resistance: 177,780
Main Resistance / Initial Target: 180,700
Final Resistance: 190,800
---
Conclusion
The index maintains a bullish bias on the 1-hour timeframe, with strong potential for further upside continuation toward the 180,700 level before any major corrective phase develops.

إخلاء المسؤولية
لا يُقصد بالمعلومات والمنشورات أن تكون، أو تشكل، أي نصيحة مالية أو استثمارية أو تجارية أو أنواع أخرى من النصائح أو التوصيات المقدمة أو المعتمدة من TradingView. اقرأ المزيد في شروط الاستخدام.
إخلاء المسؤولية
لا يُقصد بالمعلومات والمنشورات أن تكون، أو تشكل، أي نصيحة مالية أو استثمارية أو تجارية أو أنواع أخرى من النصائح أو التوصيات المقدمة أو المعتمدة من TradingView. اقرأ المزيد في شروط الاستخدام.