شراء
MATICUSDT
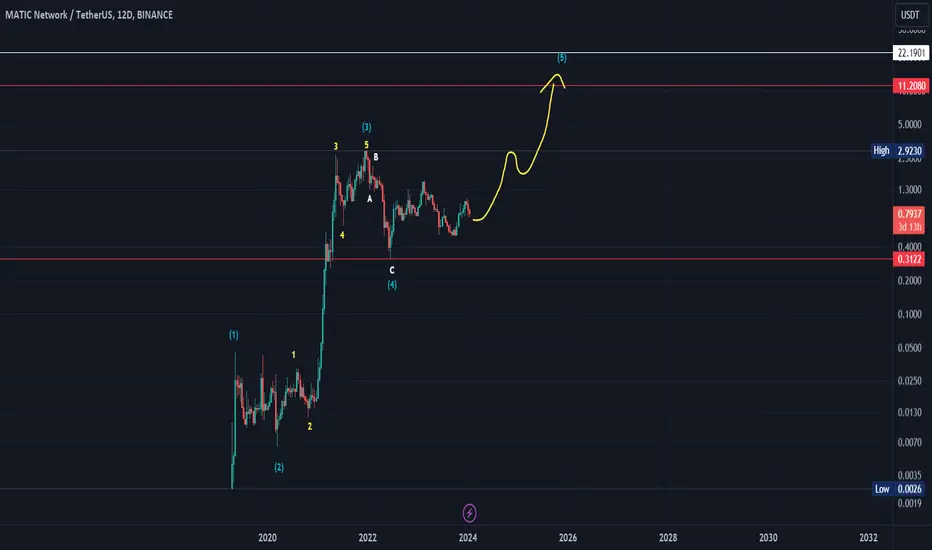
From the data shown on the chart, we find that as long as the currency does not break the bottom of the area 0.5 usdt , this indicates the accumulation of a new wave of payment, in addition to the fact that the currency against Bitcoin has been going sideways for 31 monthly candles, and this indicates the upcoming stages of accumulation and a calming of the previous indicators of inflation.
All data on the chart.. Good luck
All data on the chart.. Good luck
تم حذف الأمر

إخلاء المسؤولية
لا يُقصد بالمعلومات والمنشورات أن تكون، أو تشكل، أي نصيحة مالية أو استثمارية أو تجارية أو أنواع أخرى من النصائح أو التوصيات المقدمة أو المعتمدة من TradingView. اقرأ المزيد في شروط الاستخدام.
إخلاء المسؤولية
لا يُقصد بالمعلومات والمنشورات أن تكون، أو تشكل، أي نصيحة مالية أو استثمارية أو تجارية أو أنواع أخرى من النصائح أو التوصيات المقدمة أو المعتمدة من TradingView. اقرأ المزيد في شروط الاستخدام.