
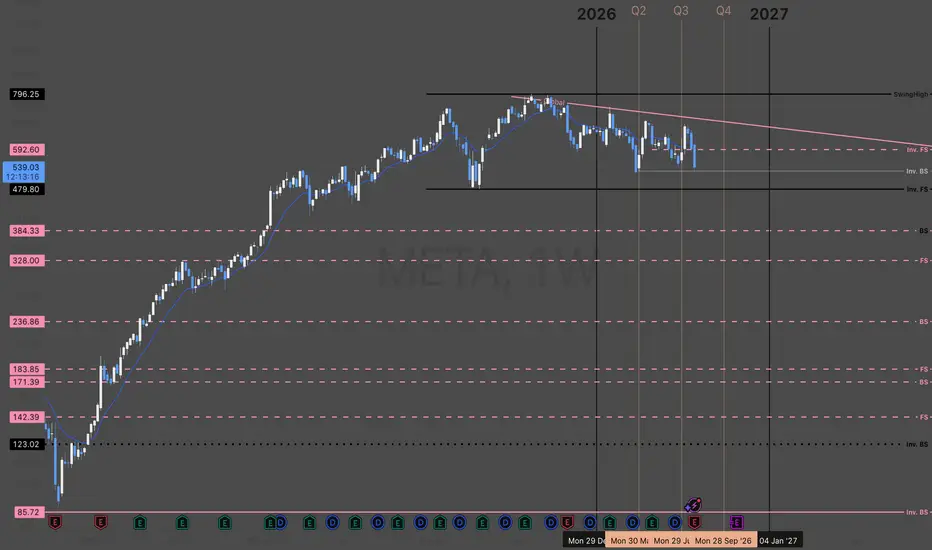
Meta Platforms, Inc.||
MARKET-BEATING SCORE = 7/10
"engages in the development of social media applications. It builds technology that helps people connect, find communities, and grow businesses.."
-----------------------------------
PEGY 1.12 — mildly overvalued.
EPS growth 18.6% — solid.
Revenue growing 28.0% YoY — strong.
Gross margin 81.8% — strong moat.
FCF margin 22.4% — real cash generation.
D/E 0.43 — conservative leverage.
-----------------------------------
KEY RISK ASSESSMENT
"Could a policy change or major competitor disrupt growth in the next 2 years?"
Meta faces significant headwinds from evolving global regulations, particularly the EU’s Digital Markets Act and ongoing FTC antitrust litigation, which could limit data collection and acquisition strategies. The persistent dominance of TikTok in the short-form video space continues to challenge engagement metrics, while the rapid shift toward generative AI necessitates massive capital expenditures that may pressure margins. These factors, combined with potential policy shifts regarding Section 230 and user privacy, create a volatile environment for sustained growth over the next two years.
Risk Level:
High
----------------------------------
POSITIVE CATALYST OUTLOOK
"Could a policy change or competitor headwinds create a positive catalyst in the next 2 years?"
The potential U.S. ban or forced divestiture of TikTok represents a major positive catalyst, as it would likely shift significant market share and advertising revenue toward Meta’s Reels platform. Furthermore, Meta’s strategic pivot to open-source AI via Llama provides a cost and innovation advantage over competitors, enhancing its ad-targeting capabilities and user engagement. Finally, increased regulatory pressure on other Big Tech rivals may create a more favorable relative competitive landscape for Meta to expand its dominance in social commerce and messaging.
Positive Outlook:
High
-----------------------------------
Multiple Time-Frame Analysis; Color Code | Strength favors the higher timeframe.
Yearly timeframe = black
Monthly timeframe = pink
weekly = grey
daily = red
4hr = orange
1hr = yellow
15min = blue
5min = green if they are shown. (Level visibility on intervals is set to timeframe the level was found on and below to keep chart view organized.)
** Candle Science explained **
A Range = two or more consecutive color candles.
There are two types of ranges - accumulation and distribution. **A single candle is a range on a lower timeframe. *Find the range and define its, creation dates, prices, and risk parameters. A range is broken down into 4 candle, which create 6 levels that define the range and illustrate market structure.
Focus only on the first and last candle of each range. The last candle of each type of range has two levels - see FS & Inv. FS Candles below.
DISTRIBUTION RANGES DEFINED:
When price is above a distribution range, these candles/levels act as support.
(BS) BACKSIDE Candle - First distribution candle in a distribution range. Expectation = strong reaction to price. long wicks reaching to or away from level. high angle accumulation trends, f.v,g's
(FS) FrontSide Candle - Last distribution candle in a distribution range. Expectation = reversal, create a low angle accumulation trend. The top of Distribution candles are used as support. The bottom of the FrontSide candle is the SwingLow of the range. The FS candle wants to protect the SwingLow. When/if Price Action closes below the SwingLow, the level is invalidated. Find another range to trade.
ACCUMULATION RANGES DEFINED: When price is below an accumulation range, these candles/levels act as resistance.
INVERSE BACKSIDE (Inv.BS) - First Accumulation candle in an accumulation range. Expectation. = strong reaction to price. long wicks reaching to or away from level. Creates high angle distribution trends, f.v.g, protects the Inv.FS candle
INVERSE FRONTSIDE (Inv.FS) - Last accumulation candle in an accumulation range. Expectation = reversal, create a low angle distribution trend. The bottom of Accumulation candles are used as resistance.
The top of the Inv.FrontSide candle is the SwingHigh of the range. The Inv.FS candle wants to protect the SwingHigh. When/if Price Action closes above the SwingHigh, the level is invalidated. Find another range to trade.
MARKET-BEATING SCORE = 7/10
"engages in the development of social media applications. It builds technology that helps people connect, find communities, and grow businesses.."
-----------------------------------
PEGY 1.12 — mildly overvalued.
EPS growth 18.6% — solid.
Revenue growing 28.0% YoY — strong.
Gross margin 81.8% — strong moat.
FCF margin 22.4% — real cash generation.
D/E 0.43 — conservative leverage.
-----------------------------------
KEY RISK ASSESSMENT
"Could a policy change or major competitor disrupt growth in the next 2 years?"
Meta faces significant headwinds from evolving global regulations, particularly the EU’s Digital Markets Act and ongoing FTC antitrust litigation, which could limit data collection and acquisition strategies. The persistent dominance of TikTok in the short-form video space continues to challenge engagement metrics, while the rapid shift toward generative AI necessitates massive capital expenditures that may pressure margins. These factors, combined with potential policy shifts regarding Section 230 and user privacy, create a volatile environment for sustained growth over the next two years.
Risk Level:
High
----------------------------------
POSITIVE CATALYST OUTLOOK
"Could a policy change or competitor headwinds create a positive catalyst in the next 2 years?"
The potential U.S. ban or forced divestiture of TikTok represents a major positive catalyst, as it would likely shift significant market share and advertising revenue toward Meta’s Reels platform. Furthermore, Meta’s strategic pivot to open-source AI via Llama provides a cost and innovation advantage over competitors, enhancing its ad-targeting capabilities and user engagement. Finally, increased regulatory pressure on other Big Tech rivals may create a more favorable relative competitive landscape for Meta to expand its dominance in social commerce and messaging.
Positive Outlook:
High
-----------------------------------
Multiple Time-Frame Analysis; Color Code | Strength favors the higher timeframe.
Yearly timeframe = black
Monthly timeframe = pink
weekly = grey
daily = red
4hr = orange
1hr = yellow
15min = blue
5min = green if they are shown. (Level visibility on intervals is set to timeframe the level was found on and below to keep chart view organized.)
** Candle Science explained **
A Range = two or more consecutive color candles.
There are two types of ranges - accumulation and distribution. **A single candle is a range on a lower timeframe. *Find the range and define its, creation dates, prices, and risk parameters. A range is broken down into 4 candle, which create 6 levels that define the range and illustrate market structure.
Focus only on the first and last candle of each range. The last candle of each type of range has two levels - see FS & Inv. FS Candles below.
DISTRIBUTION RANGES DEFINED:
When price is above a distribution range, these candles/levels act as support.
(BS) BACKSIDE Candle - First distribution candle in a distribution range. Expectation = strong reaction to price. long wicks reaching to or away from level. high angle accumulation trends, f.v,g's
(FS) FrontSide Candle - Last distribution candle in a distribution range. Expectation = reversal, create a low angle accumulation trend. The top of Distribution candles are used as support. The bottom of the FrontSide candle is the SwingLow of the range. The FS candle wants to protect the SwingLow. When/if Price Action closes below the SwingLow, the level is invalidated. Find another range to trade.
ACCUMULATION RANGES DEFINED: When price is below an accumulation range, these candles/levels act as resistance.
INVERSE BACKSIDE (Inv.BS) - First Accumulation candle in an accumulation range. Expectation. = strong reaction to price. long wicks reaching to or away from level. Creates high angle distribution trends, f.v.g, protects the Inv.FS candle
INVERSE FRONTSIDE (Inv.FS) - Last accumulation candle in an accumulation range. Expectation = reversal, create a low angle distribution trend. The bottom of Accumulation candles are used as resistance.
The top of the Inv.FrontSide candle is the SwingHigh of the range. The Inv.FS candle wants to protect the SwingHigh. When/if Price Action closes above the SwingHigh, the level is invalidated. Find another range to trade.

إخلاء المسؤولية
لا يُقصد بالمعلومات والمنشورات أن تكون، أو تشكل، أي نصيحة مالية أو استثمارية أو تجارية أو أنواع أخرى من النصائح أو التوصيات المقدمة أو المعتمدة من TradingView. اقرأ المزيد في شروط الاستخدام.
إخلاء المسؤولية
لا يُقصد بالمعلومات والمنشورات أن تكون، أو تشكل، أي نصيحة مالية أو استثمارية أو تجارية أو أنواع أخرى من النصائح أو التوصيات المقدمة أو المعتمدة من TradingView. اقرأ المزيد في شروط الاستخدام.