
Market Structure: Microsoft Breaks Back Toward Highs — Can Buyers Extend the Rally?
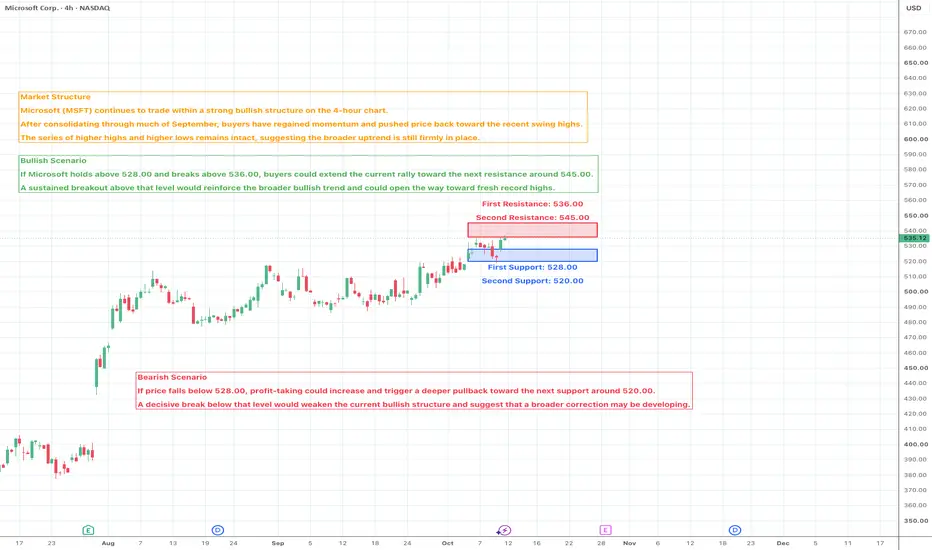
Microsoft (MSFT) continues to trade within a strong bullish structure on the 4-hour chart. After consolidating through much of September, buyers have regained momentum and pushed price back toward the recent swing highs. The series of higher highs and higher lows remains intact, suggesting the broader uptrend is still firmly in place.
Market Sentiment - Moderately Bullish
Market sentiment remains moderately bullish. Buying pressure has strengthened following the recent breakout from consolidation, while selling attempts have remained shallow. Unless key support is lost, buyers continue to hold the short-term advantage.
Bullish Scenario
If Microsoft holds above 528.00 and breaks above 536.00, buyers could extend the current rally toward the next resistance around 545.00. A sustained breakout above that level would reinforce the broader bullish trend and could open the way toward fresh record highs.
Bearish Scenario
If price falls below 528.00, profit-taking could increase and trigger a deeper pullback toward the next support around 520.00. A decisive break below that level would weaken the current bullish structure and suggest that a broader correction may be developing.
────────────────────
Market Outlook
Microsoft continues to trade near the upper end of its recent range, reflecting solid buying interest despite previous consolidation. As long as key support remains intact, the overall trend continues to favor the upside, although traders should monitor for short-term exhaustion after the recent advance.
────────────────────
Key Levels
First Resistance: 536.00
Second Resistance: 545.00
First Support: 528.00
Second Support: 520.00
────────────────────
Future Scenarios
A sustained move above the First Resistance would confirm renewed bullish momentum and could extend the advance toward the Second Resistance.
However, if price breaks below the First Support, bearish pressure may increase and expose the Second Support, signaling a deeper corrective move.
────────────────────
Event Risk
Microsoft may remain sensitive to upcoming U.S. economic data, Federal Reserve commentary, Treasury yield movements, AI-related developments, corporate earnings expectations, and overall Nasdaq sentiment.
However, price action remains the key indicator. If positive news cannot push price above the First Resistance, upside momentum may begin to fade. Conversely, if Microsoft breaks below the First Support despite supportive headlines, it would indicate sellers are gradually regaining control.
────────────────────
Please share your view below:
Do you expect Microsoft to break into new highs, or is a short-term pullback becoming more likely from current levels?
More market structure and key level updates will be shared regularly.
Microsoft (MSFT) continues to trade within a strong bullish structure on the 4-hour chart. After consolidating through much of September, buyers have regained momentum and pushed price back toward the recent swing highs. The series of higher highs and higher lows remains intact, suggesting the broader uptrend is still firmly in place.
Market Sentiment - Moderately Bullish
Market sentiment remains moderately bullish. Buying pressure has strengthened following the recent breakout from consolidation, while selling attempts have remained shallow. Unless key support is lost, buyers continue to hold the short-term advantage.
Bullish Scenario
If Microsoft holds above 528.00 and breaks above 536.00, buyers could extend the current rally toward the next resistance around 545.00. A sustained breakout above that level would reinforce the broader bullish trend and could open the way toward fresh record highs.
Bearish Scenario
If price falls below 528.00, profit-taking could increase and trigger a deeper pullback toward the next support around 520.00. A decisive break below that level would weaken the current bullish structure and suggest that a broader correction may be developing.
────────────────────
Market Outlook
Microsoft continues to trade near the upper end of its recent range, reflecting solid buying interest despite previous consolidation. As long as key support remains intact, the overall trend continues to favor the upside, although traders should monitor for short-term exhaustion after the recent advance.
────────────────────
Key Levels
First Resistance: 536.00
Second Resistance: 545.00
First Support: 528.00
Second Support: 520.00
────────────────────
Future Scenarios
A sustained move above the First Resistance would confirm renewed bullish momentum and could extend the advance toward the Second Resistance.
However, if price breaks below the First Support, bearish pressure may increase and expose the Second Support, signaling a deeper corrective move.
────────────────────
Event Risk
Microsoft may remain sensitive to upcoming U.S. economic data, Federal Reserve commentary, Treasury yield movements, AI-related developments, corporate earnings expectations, and overall Nasdaq sentiment.
However, price action remains the key indicator. If positive news cannot push price above the First Resistance, upside momentum may begin to fade. Conversely, if Microsoft breaks below the First Support despite supportive headlines, it would indicate sellers are gradually regaining control.
────────────────────
Please share your view below:
Do you expect Microsoft to break into new highs, or is a short-term pullback becoming more likely from current levels?
More market structure and key level updates will be shared regularly.

منشورات ذات صلة
إخلاء المسؤولية
لا يُقصد بالمعلومات والمنشورات أن تكون، أو تشكل، أي نصيحة مالية أو استثمارية أو تجارية أو أنواع أخرى من النصائح أو التوصيات المقدمة أو المعتمدة من TradingView. اقرأ المزيد في شروط الاستخدام.
منشورات ذات صلة
إخلاء المسؤولية
لا يُقصد بالمعلومات والمنشورات أن تكون، أو تشكل، أي نصيحة مالية أو استثمارية أو تجارية أو أنواع أخرى من النصائح أو التوصيات المقدمة أو المعتمدة من TradingView. اقرأ المزيد في شروط الاستخدام.