
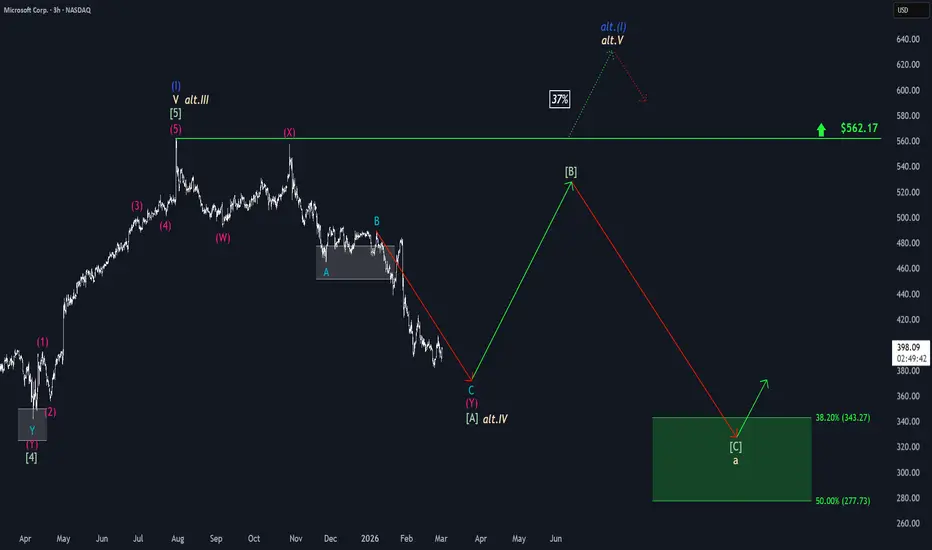
The low of the green wave [A] is getting closer. Once it has been established, we initially expect a noticeable recovery in wave [B]. However, this countermovement is likely to be only temporary before the sell-off of the higher-level beige wave a continues (still below the resistance at $562.17) and ultimately leads MSFT into our green Long Target Zone between $343.27 and $277.73. With a probability of 37%, the stock could be forming the low of the beige wave alt.IV. In this case, a dynamic rise would be expected afterward, which would carry price above the resistance at $562.17 as part of the higher-level blue wave alt.(I).

📊 Daily market insights combining macro + Elliott Wave analysis
🚀 Spot trends early with momentum, sentiment & price structure
🌐 Join thousands trading smarter at hkcmglobal.com
🚀 Spot trends early with momentum, sentiment & price structure
🌐 Join thousands trading smarter at hkcmglobal.com
منشورات ذات صلة
إخلاء المسؤولية
لا يُقصد بالمعلومات والمنشورات أن تكون، أو تشكل، أي نصيحة مالية أو استثمارية أو تجارية أو أنواع أخرى من النصائح أو التوصيات المقدمة أو المعتمدة من TradingView. اقرأ المزيد في شروط الاستخدام.