
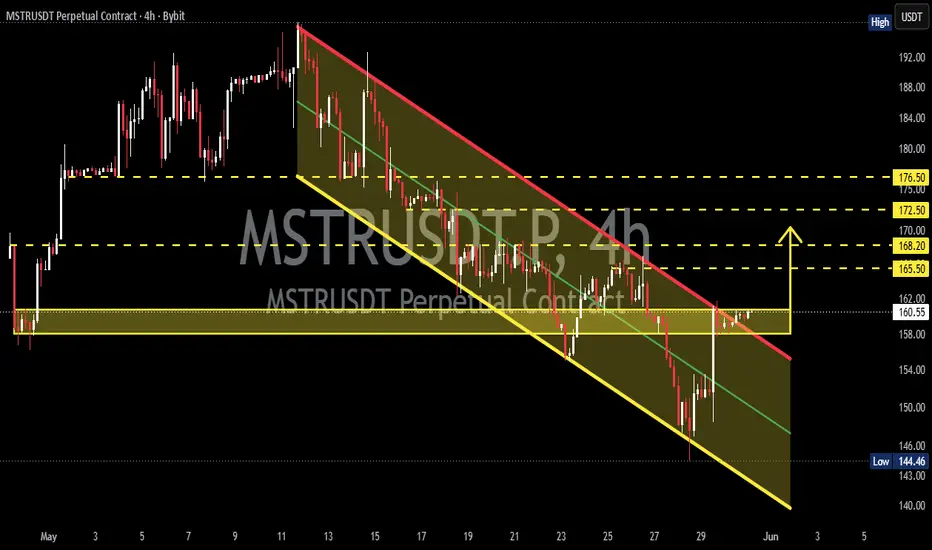
On the 4-hour timeframe, MSTRUSDT is still moving within a Descending Channel that has been developing since the peak around 194 USDT. This structure indicates that the market remains in a correction phase, forming a consistent sequence of Lower Highs (LH) and Lower Lows (LL). 📉
However, after reaching a low near 144 USDT, the price managed to stage a strong rebound 🚀 and is now retesting the important Demand Zone at 158.0 – 160.7 USDT (yellow block).
At the moment, this area serves as a major decision point that could determine the next market direction. ⚡
---
📐 Pattern Formation: Descending Channel
A Descending Channel is a pattern formed when price moves between two parallel downward-sloping trendlines.
🔍 Key Characteristics Visible on the Chart:
✅ Lower Highs continue to form along the upper trendline.
✅ Lower Lows continue to form along the lower trendline.
✅ Price is currently retesting the upper resistance boundary of the channel.
✅ The reclaim of the 158.0–160.7 demand zone suggests that buyers are beginning to step back into the market.
📚 From a technical perspective, a breakout above a Descending Channel often signals the early stages of a trend reversal from bearish to bullish.
---
🟨 Key Levels to Watch
🛡️ Demand Zone
158.0 – 160.7 USDT
This area currently acts as the primary support zone.
If price can maintain strength above this zone, the probability of a recovery toward higher resistance levels increases significantly. 📈
---
🎯 Major Resistance Levels
🔸 165.50 USDT
🔸 168.20 USDT
🔸 172.50 USDT
🔸 176.50 USDT
These horizontal resistance levels are clearly marked on the chart and could become the next upside targets if a breakout occurs. 🚀
---
🟢 Bullish Scenario
✅ Bullish Confirmation
✔️ Price holds above the 158.0–160.7 demand zone.
✔️ Breakout above the upper Descending Channel trendline.
✔️ Increased buying volume during the breakout.
If this scenario unfolds, potential upside targets include:
🎯 165.50 USDT
🎯 168.20 USDT
🎯 172.50 USDT
🎯 176.50 USDT
🔥 A successful breakout above 176.50 USDT would invalidate the short-term bearish structure and open the door for a larger bullish continuation.
---
🔴 Bearish Scenario
❌ Bearish Confirmation
✖️ Price fails to hold the 158.0–160.7 demand zone.
✖️ Strong rejection from the upper channel trendline.
✖️ Price falls back into the channel with increasing selling pressure.
If this scenario occurs, downside targets could include:
🎯 154.00 USDT
🎯 150.00 USDT
🎯 146.00 USDT
🎯 Lower channel support around 140–142 USDT
⚠️ As long as price remains inside the Descending Channel, the medium-term trend remains bearish.
---
📌 Conclusion
MSTRUSDT is currently trading at a critical decision point after reclaiming the 158.0–160.7 USDT demand zone. This area now serves as a crucial foundation for buyers attempting to push the price out of the Descending Channel that has dominated the market for several weeks.
🚀 A confirmed breakout from the channel could trigger a rally toward the 165–176 USDT region.
📉 On the other hand, failure to defend the demand zone could result in another move back toward previous lows.
👀 Traders should closely monitor price action around the 158.0–160.7 USDT zone and watch for a potential breakout above the channel resistance for confirmation of the next directional move.
---
⚠️ Disclaimer
This analysis is for educational purposes only and should not be considered financial advice. Always conduct your own research and apply proper risk management before making trading decisions.
#MSTRUSDT #MSTR #Crypto #Cryptocurrency #TradingView #TechnicalAnalysis #PriceAction #DescendingChannel #BullishBreakout #BearishTrend #SupportResistance #CryptoTrading #AltcoinAnalysis #Bybit #FuturesTrading #MarketStructure #TrendAnalysis #SmartMoney #TradingSetup #ChartAnalysis
However, after reaching a low near 144 USDT, the price managed to stage a strong rebound 🚀 and is now retesting the important Demand Zone at 158.0 – 160.7 USDT (yellow block).
At the moment, this area serves as a major decision point that could determine the next market direction. ⚡
---
📐 Pattern Formation: Descending Channel
A Descending Channel is a pattern formed when price moves between two parallel downward-sloping trendlines.
🔍 Key Characteristics Visible on the Chart:
✅ Lower Highs continue to form along the upper trendline.
✅ Lower Lows continue to form along the lower trendline.
✅ Price is currently retesting the upper resistance boundary of the channel.
✅ The reclaim of the 158.0–160.7 demand zone suggests that buyers are beginning to step back into the market.
📚 From a technical perspective, a breakout above a Descending Channel often signals the early stages of a trend reversal from bearish to bullish.
---
🟨 Key Levels to Watch
🛡️ Demand Zone
158.0 – 160.7 USDT
This area currently acts as the primary support zone.
If price can maintain strength above this zone, the probability of a recovery toward higher resistance levels increases significantly. 📈
---
🎯 Major Resistance Levels
🔸 165.50 USDT
🔸 168.20 USDT
🔸 172.50 USDT
🔸 176.50 USDT
These horizontal resistance levels are clearly marked on the chart and could become the next upside targets if a breakout occurs. 🚀
---
🟢 Bullish Scenario
✅ Bullish Confirmation
✔️ Price holds above the 158.0–160.7 demand zone.
✔️ Breakout above the upper Descending Channel trendline.
✔️ Increased buying volume during the breakout.
If this scenario unfolds, potential upside targets include:
🎯 165.50 USDT
🎯 168.20 USDT
🎯 172.50 USDT
🎯 176.50 USDT
🔥 A successful breakout above 176.50 USDT would invalidate the short-term bearish structure and open the door for a larger bullish continuation.
---
🔴 Bearish Scenario
❌ Bearish Confirmation
✖️ Price fails to hold the 158.0–160.7 demand zone.
✖️ Strong rejection from the upper channel trendline.
✖️ Price falls back into the channel with increasing selling pressure.
If this scenario occurs, downside targets could include:
🎯 154.00 USDT
🎯 150.00 USDT
🎯 146.00 USDT
🎯 Lower channel support around 140–142 USDT
⚠️ As long as price remains inside the Descending Channel, the medium-term trend remains bearish.
---
📌 Conclusion
MSTRUSDT is currently trading at a critical decision point after reclaiming the 158.0–160.7 USDT demand zone. This area now serves as a crucial foundation for buyers attempting to push the price out of the Descending Channel that has dominated the market for several weeks.
🚀 A confirmed breakout from the channel could trigger a rally toward the 165–176 USDT region.
📉 On the other hand, failure to defend the demand zone could result in another move back toward previous lows.
👀 Traders should closely monitor price action around the 158.0–160.7 USDT zone and watch for a potential breakout above the channel resistance for confirmation of the next directional move.
---
⚠️ Disclaimer
This analysis is for educational purposes only and should not be considered financial advice. Always conduct your own research and apply proper risk management before making trading decisions.
#MSTRUSDT #MSTR #Crypto #Cryptocurrency #TradingView #TechnicalAnalysis #PriceAction #DescendingChannel #BullishBreakout #BearishTrend #SupportResistance #CryptoTrading #AltcoinAnalysis #Bybit #FuturesTrading #MarketStructure #TrendAnalysis #SmartMoney #TradingSetup #ChartAnalysis

✅ Get Free Signals! Join Our Telegram Channel Here: t.me/TheCryptoNuclear
✅ Twitter: twitter.com/crypto_nuclear
✅ Join Bybit : partner.bybit.com/b/nuclearvip
✅ Benefits : Lifetime Trading Fee Discount -50%
✅ Twitter: twitter.com/crypto_nuclear
✅ Join Bybit : partner.bybit.com/b/nuclearvip
✅ Benefits : Lifetime Trading Fee Discount -50%
إخلاء المسؤولية
لا يُقصد بالمعلومات والمنشورات أن تكون، أو تشكل، أي نصيحة مالية أو استثمارية أو تجارية أو أنواع أخرى من النصائح أو التوصيات المقدمة أو المعتمدة من TradingView. اقرأ المزيد في شروط الاستخدام.
✅ Get Free Signals! Join Our Telegram Channel Here: t.me/TheCryptoNuclear
✅ Twitter: twitter.com/crypto_nuclear
✅ Join Bybit : partner.bybit.com/b/nuclearvip
✅ Benefits : Lifetime Trading Fee Discount -50%
✅ Twitter: twitter.com/crypto_nuclear
✅ Join Bybit : partner.bybit.com/b/nuclearvip
✅ Benefits : Lifetime Trading Fee Discount -50%
إخلاء المسؤولية
لا يُقصد بالمعلومات والمنشورات أن تكون، أو تشكل، أي نصيحة مالية أو استثمارية أو تجارية أو أنواع أخرى من النصائح أو التوصيات المقدمة أو المعتمدة من TradingView. اقرأ المزيد في شروط الاستخدام.