
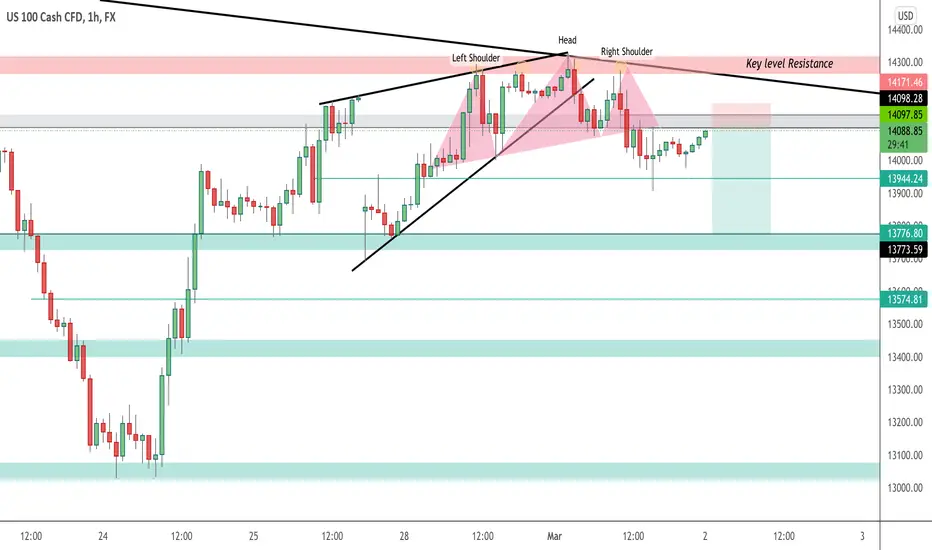
Price has previously created a rising wedge pattern, & has broken it to the downside after failing multiple times to break above key level resistance, which aligns with the higher timeframe descending trend line which was rejected for a "3rd time today. Price also has formed a head on shoulders formation on the lower timeframe & has made a successful break & retest of the neckline. I am watching the intraday supply zone here for price to print a fresh lower high, where then on the lower timeframe I will be anticipating for price to make a lower low towards 4 Hour support below.
ملاحظة
ملاحظة
ملاحظة

إخلاء المسؤولية
لا يُقصد بالمعلومات والمنشورات أن تكون، أو تشكل، أي نصيحة مالية أو استثمارية أو تجارية أو أنواع أخرى من النصائح أو التوصيات المقدمة أو المعتمدة من TradingView. اقرأ المزيد في شروط الاستخدام.
إخلاء المسؤولية
لا يُقصد بالمعلومات والمنشورات أن تكون، أو تشكل، أي نصيحة مالية أو استثمارية أو تجارية أو أنواع أخرى من النصائح أو التوصيات المقدمة أو المعتمدة من TradingView. اقرأ المزيد في شروط الاستخدام.