
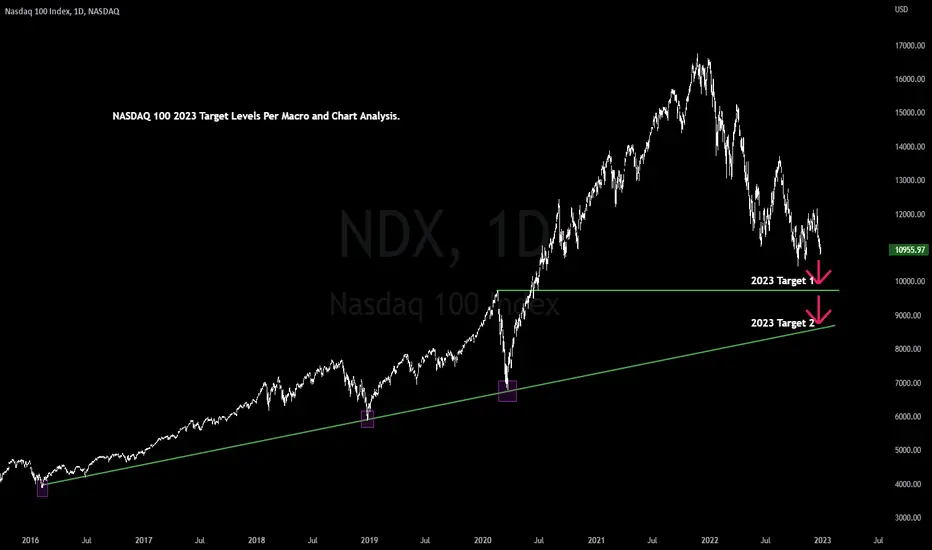
Here we are looking at NDX on the daily TF.
As shown on the chart, we are analyzing two supports (Green).
It’s important to note that these are both support lines. The upsloping on (the bottom one) and the horizontal trend line (top trend line) will both serve as strong support.
Once target 1 is hit, there will be a small bounce for a few weeks to a couple of months.
If the support breaks through the first target there will be further downside to the second target.
Currently, NDX finds itself testing support, though we’re ready for a breakdown if it can’t hold.
We will continue to monitor price action, and will follow up on this post when there’s either a small bounce and/or breakdown.
What is your prediction on what the NDX?
Cheers!
As shown on the chart, we are analyzing two supports (Green).
It’s important to note that these are both support lines. The upsloping on (the bottom one) and the horizontal trend line (top trend line) will both serve as strong support.
Once target 1 is hit, there will be a small bounce for a few weeks to a couple of months.
If the support breaks through the first target there will be further downside to the second target.
Currently, NDX finds itself testing support, though we’re ready for a breakdown if it can’t hold.
We will continue to monitor price action, and will follow up on this post when there’s either a small bounce and/or breakdown.
What is your prediction on what the NDX?
Cheers!

Get trade alerts with exact entries and exits + daily videos with deep dive technical analysis on stocks, crypto, commodities and options. Find these at VerifiedInvesting.com
إخلاء المسؤولية
لا يُقصد بالمعلومات والمنشورات أن تكون، أو تشكل، أي نصيحة مالية أو استثمارية أو تجارية أو أنواع أخرى من النصائح أو التوصيات المقدمة أو المعتمدة من TradingView. اقرأ المزيد في شروط الاستخدام.
Get trade alerts with exact entries and exits + daily videos with deep dive technical analysis on stocks, crypto, commodities and options. Find these at VerifiedInvesting.com
إخلاء المسؤولية
لا يُقصد بالمعلومات والمنشورات أن تكون، أو تشكل، أي نصيحة مالية أو استثمارية أو تجارية أو أنواع أخرى من النصائح أو التوصيات المقدمة أو المعتمدة من TradingView. اقرأ المزيد في شروط الاستخدام.