
Cloudflare, Inc.
NET - CURRENT PRICE : 195.85
📈 Monthly Chart Technical Analysis

On the monthly timeframe, NET is showing a strong bullish development as the RSI crosses back above the 60 level. Historically, there were two previous instances where RSI moved above 60 on the monthly chart — and both times were followed by significant upside price expansion (look at the two vertical green line). This indicates that the 60 level acts as a momentum confirmation zone rather than a sign of exhaustion.
Currently, RSI is reclaiming bullish territory again, signaling strengthening momentum. This move is further supported by a bullish piercing line candlestick pattern, suggesting buyers are stepping in with conviction after a pullback phase.
However, it is important to note that February’s monthly candle is not fully formed yet, as we are still in the middle of the month. Aggressive traders may enter ahead of confirmation, positioning early while momentum builds.
📈 Daily Chart Technical Analysis
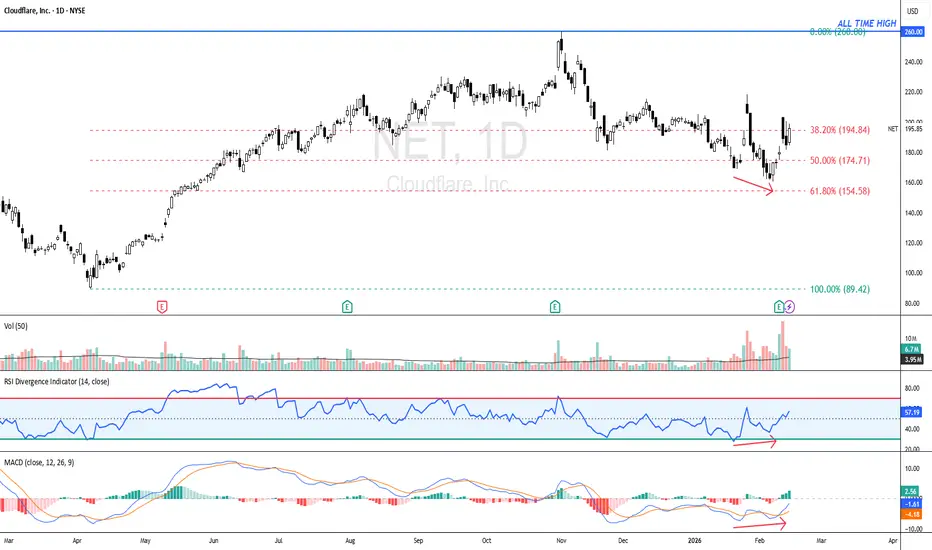
On the daily timeframe, NET is forming a compelling technical buy setup. Firstly, a clear bullish divergence is present, where price made a lower low while momentum indicators such as RSI and MACD formed higher lows. This signals that selling pressure is weakening and downside momentum is fading — often an early indication of a potential reversal.
Secondly, the RSI has crossed back above the 50 level, which suggests momentum has shifted back into bullish territory and buyers are regaining control. Take note also that RSI is still below 70, indicating there is room for further upside.
Lastly, the recent pullback appears technically healthy, as price retraced toward the Golden Ratio (around the 61.8% Fibonacci level) and found support without breaking the overall structure. This type of controlled retracement within an uptrend typically strengthens the case for continuation. Taken together — bullish divergence, RSI reclaiming 50, and a healthy retracement — the daily chart supports a technical buy bias with improving short-term momentum.
ENTRY PRICE : 190.00 - 195.85
FIRST TARGET : 230.00
SECOND TARGET : 245.00
SUPPORT : 160.35 (the low of 06 FEB 2026 candle)
Notes : According to moomoo platform, recent broker updates remain constructive, with multiple institutions maintaining or upgrading to Buy ratings. Target prices range between $190 and $265, with broader analyst projections indicating potential upside toward the $225–$300 zone, supporting the ongoing bullish technical structure.
NET - CURRENT PRICE : 195.85
📈 Monthly Chart Technical Analysis
On the monthly timeframe, NET is showing a strong bullish development as the RSI crosses back above the 60 level. Historically, there were two previous instances where RSI moved above 60 on the monthly chart — and both times were followed by significant upside price expansion (look at the two vertical green line). This indicates that the 60 level acts as a momentum confirmation zone rather than a sign of exhaustion.
Currently, RSI is reclaiming bullish territory again, signaling strengthening momentum. This move is further supported by a bullish piercing line candlestick pattern, suggesting buyers are stepping in with conviction after a pullback phase.
However, it is important to note that February’s monthly candle is not fully formed yet, as we are still in the middle of the month. Aggressive traders may enter ahead of confirmation, positioning early while momentum builds.
📈 Daily Chart Technical Analysis
On the daily timeframe, NET is forming a compelling technical buy setup. Firstly, a clear bullish divergence is present, where price made a lower low while momentum indicators such as RSI and MACD formed higher lows. This signals that selling pressure is weakening and downside momentum is fading — often an early indication of a potential reversal.
Secondly, the RSI has crossed back above the 50 level, which suggests momentum has shifted back into bullish territory and buyers are regaining control. Take note also that RSI is still below 70, indicating there is room for further upside.
Lastly, the recent pullback appears technically healthy, as price retraced toward the Golden Ratio (around the 61.8% Fibonacci level) and found support without breaking the overall structure. This type of controlled retracement within an uptrend typically strengthens the case for continuation. Taken together — bullish divergence, RSI reclaiming 50, and a healthy retracement — the daily chart supports a technical buy bias with improving short-term momentum.
ENTRY PRICE : 190.00 - 195.85
FIRST TARGET : 230.00
SECOND TARGET : 245.00
SUPPORT : 160.35 (the low of 06 FEB 2026 candle)
Notes : According to moomoo platform, recent broker updates remain constructive, with multiple institutions maintaining or upgrading to Buy ratings. Target prices range between $190 and $265, with broader analyst projections indicating potential upside toward the $225–$300 zone, supporting the ongoing bullish technical structure.

إخلاء المسؤولية
لا يُقصد بالمعلومات والمنشورات أن تكون، أو تشكل، أي نصيحة مالية أو استثمارية أو تجارية أو أنواع أخرى من النصائح أو التوصيات المقدمة أو المعتمدة من TradingView. اقرأ المزيد في شروط الاستخدام.
إخلاء المسؤولية
لا يُقصد بالمعلومات والمنشورات أن تكون، أو تشكل، أي نصيحة مالية أو استثمارية أو تجارية أو أنواع أخرى من النصائح أو التوصيات المقدمة أو المعتمدة من TradingView. اقرأ المزيد في شروط الاستخدام.