
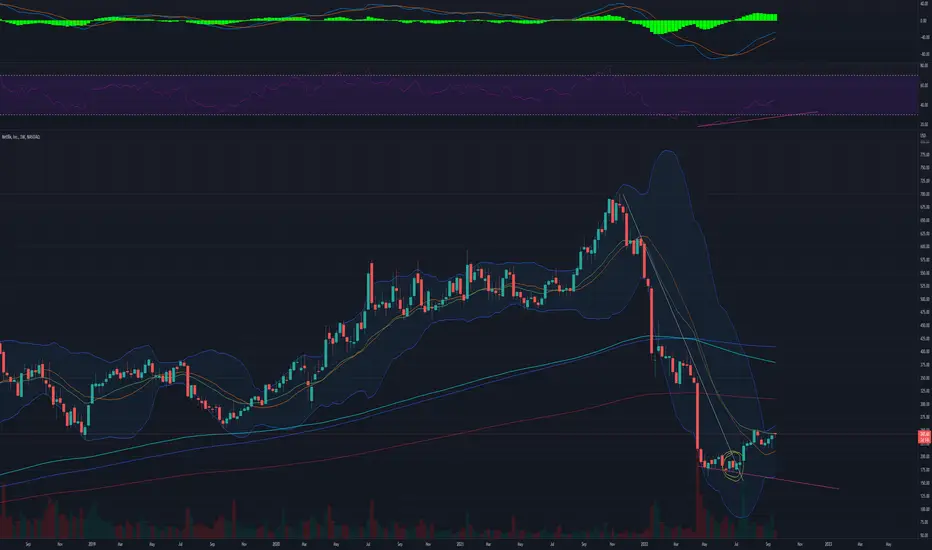
A simple trendline following the Netflix crash. I drew it in when there was a clear second local top/peak. This local top was confirmed by the April 20 crash. There is no need to try and "catch the falling knife" as eventually NFLX trended sideways until it broke the trend line . This is shown circled in yellow. Once it broke and pulled back to the trend (almost. ladder in.) line there was a good buying opportunity around $169. I decided to publish this simple chart because to me it is such a good example of some basics. I am looking for this sort of scenario to occur for BTC in the not so distant future.
Note: Additional TA; bullish divergence shown with pink trend lines .
Note: Additional TA; bullish divergence shown with pink trend lines .

إخلاء المسؤولية
لا يُقصد بالمعلومات والمنشورات أن تكون، أو تشكل، أي نصيحة مالية أو استثمارية أو تجارية أو أنواع أخرى من النصائح أو التوصيات المقدمة أو المعتمدة من TradingView. اقرأ المزيد في شروط الاستخدام.
إخلاء المسؤولية
لا يُقصد بالمعلومات والمنشورات أن تكون، أو تشكل، أي نصيحة مالية أو استثمارية أو تجارية أو أنواع أخرى من النصائح أو التوصيات المقدمة أو المعتمدة من TradingView. اقرأ المزيد في شروط الاستخدام.