
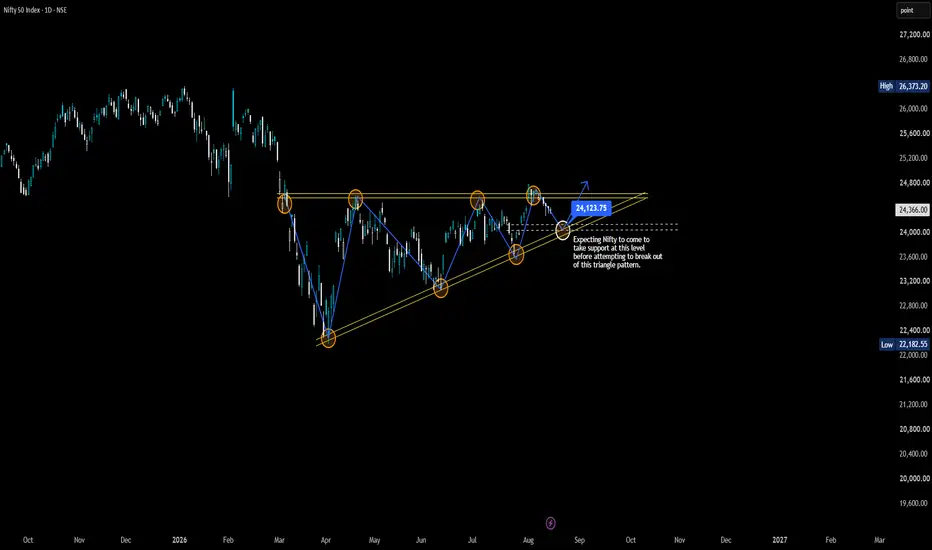
Hello traders, let's break down the current daily (1D) chart for NIFTY using pure price action.
I have marked the key levels directly on the chart for easy understanding. As you can see, Nifty has been consolidating within a highly structured ascending triangle pattern. We are seeing a textbook battle between buyers and sellers: resistance is holding firm at the top boundary, while bulls continue to step in at higher lows, signaling underlying strength and accumulation.
What I am watching right now:
The Pullback: Instead of front-running a breakout, I am anticipating a minor corrective move. I am expecting the market to come down towards the white dashed line and the circle marked on the chart before making a decisive move upwards.
The Confluence: This specific area around 24,125 acts as a crucial demand zone, aligning with previous market structure and the ascending support trendline.
The Breakout Attempt: If price action demonstrates strength and rejection of lower prices at this support level, it will set the stage for a high-probability breakout attempt above the upper resistance boundary.
Trade Psychology & Next Steps:
The most important edge a trader can have is patience. Do not anticipate the breakout before it happens. Wait for Nifty to retrace to the marked support zone, and observe the price action there. Look for candlestick confirmation (like a bullish pin bar or engulfing candle) before committing.
Trading this kind of setup is straightforward when you stick to the plan and remove emotions from the equation—mastering the psychology of patience means anybody can trade these setups successfully.
Let me know your thoughts in the comments! Are you waiting to buy the dip at support, or are you expecting a breakdown?
تم فتح الصفقة
ملاحظة
Disclaimer: This analysis is strictly for educational purposes and does not constitute financial advice. Always perform your own research and manage risk responsibly.أغلقت الصفقة: تم الوصول للهدف
If you followed the previous analysis, you know this setup worked out like clockwork. The price action followed the anticipated trajectory beautifully, allowing disciplined traders to capitalize on the structure.However, as we look at the current state of the market, there is a glaring anomaly developing that warrants immediate caution.
Key Technical Observation: The VIX Divergence
The Anomaly: Nifty has experienced a sharp fall of over 300 points recently, but the India VIX has not spiked. On the contrary, the VIX has continued to steadily fall alongside the index.
Why this is unusual: Historically, the India VIX and the NIFTY 50 maintain an inverse relationship. When the Nifty falls sharply, the India VIX (the market's "fear gauge") usually rises as traders rush to buy protective options, driving up premiums.
What it means: A falling VIX indicates that investors are not currently pricing in panic or major downside risk. Seeing this happen during a 300+ point drop in the index is highly atypical and suggests that the broader market is not actively participating in the bearish fear.
Trade Psychology & Risk Management:
Understanding the language of charts means knowing when the data is giving you mixed signals. When standard market mechanics—like the Nifty/VIX inverse correlation—break down, it is a massive red flag telling you to tighten your risk management.
Because the "fear gauge" is dropping, aggressively chasing further shorts here could be dangerous, as we might see a sudden, sharp reversal. Protect your profits from the previous move, keep position sizes small, and wait for the structure to align with market sentiment once again.
Did you manage to catch the move down? And more importantly, what is your read on this VIX anomaly? Let’s discuss in the comments!

No shortcuts. Just clean price action.
★ Price Action Academy Ecosystem
★ Institutional Market Structure & Signal Frameworks
★ Official Access: Available via TradingView Creator Program / Marketplace
Trade With Clarity.
★ Price Action Academy Ecosystem
★ Institutional Market Structure & Signal Frameworks
★ Official Access: Available via TradingView Creator Program / Marketplace
Trade With Clarity.
إخلاء المسؤولية
لا يُقصد بالمعلومات والمنشورات أن تكون، أو تشكل، أي نصيحة مالية أو استثمارية أو تجارية أو أنواع أخرى من النصائح أو التوصيات المقدمة أو المعتمدة من TradingView. اقرأ المزيد في شروط الاستخدام.