
Intro:
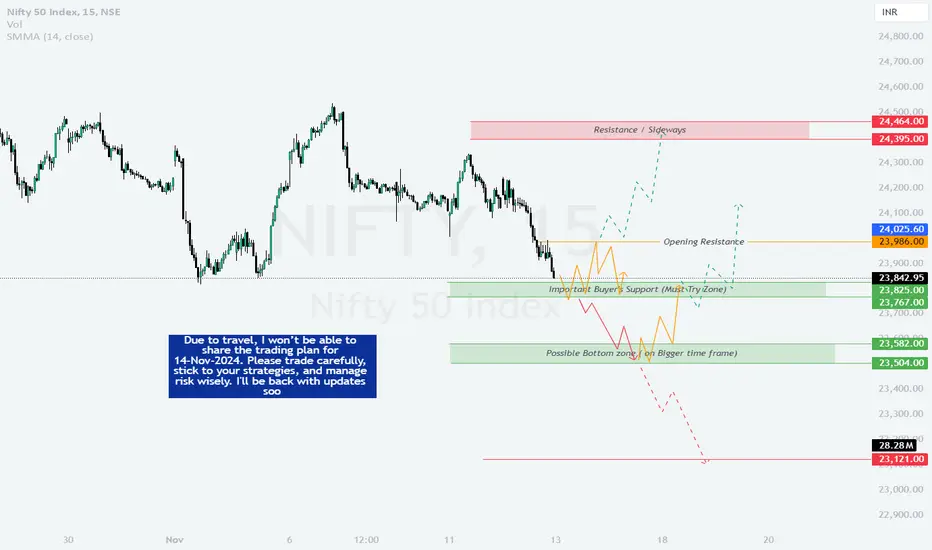
On **12-Nov-2024**, the Nifty 50 index saw consolidation in the lower zone, with strong support around the "Must Try Zone" and signs of buyer activity. Moving forward, we have identified key levels for potential bullish, bearish, and sideways movements. Yellow trends indicate potential sideways movement, Green trends represent a bullish outlook, and Red trends show bearish sentiment.
---
Trading Plan for 13-Nov-2024
---
Risk Management Tips for Options Trading:
- Limit your position size, especially near key resistance or support levels where reversals are more probable.
- In volatile market scenarios, consider using stop-loss orders based on hourly closes to avoid unnecessary stop-outs due to intraday volatility.
- Avoid entering trades in the "No Trade Zone" as highlighted on the chart, as these areas lack clear trend direction and increase the risk of whipsaw movements.
---
Summary & Conclusion:
For 13-Nov-2024, key levels to watch are 24,395 for resistance on the upside and 23,582 for critical support on the downside. Price action within the "Important Buyer’s Support" zone could dictate market direction. Green trends indicate potential bullish moves, Red trends signal bearish opportunities, and Yellow trends suggest caution with possible sideways action.
---
Disclaimer: I am not a SEBI-registered analyst. This analysis is based on my personal trading strategy and psychological theory. Please perform your analysis or consult a financial advisor before making any trading decisions.
---
Happy trading!
On **12-Nov-2024**, the Nifty 50 index saw consolidation in the lower zone, with strong support around the "Must Try Zone" and signs of buyer activity. Moving forward, we have identified key levels for potential bullish, bearish, and sideways movements. Yellow trends indicate potential sideways movement, Green trends represent a bullish outlook, and Red trends show bearish sentiment.
---
Trading Plan for 13-Nov-2024
- **Gap Up Opening (100+ points):**
If the market opens with a significant gap up beyond 24,100, watch for immediate resistance at 24,395. If Nifty sustains above this level, we may see a bullish rally toward the next resistance level at 24,464. However, if selling pressure emerges, expect the index to pull back to the "Opening Resistance" zone around 23,986, where buyers might attempt to regain control. - **Flat Opening:**
In case of a flat opening near 24,025, monitor the initial price action closely. If Nifty sustains above this level, a test of the "First Resistance Zone" around 24,361 is likely. Breaking this resistance could lead to a rally up to 24,423 or even the "Last Resistance Zone" at 24,464. Failure to break through 24,361 could result in a retracement to the "Important Buyer’s Support" at 23,825. - **Gap Down Opening (100+ points):**
A gap down opening below 23,767 would place the market within the "Important Buyer’s Support" zone. Here, a strong buyer presence could lead to a rebound toward 23,986. If this level holds, an upward move back to the "Opening Resistance" is possible. However, if the index falls below 23,582, it could signal further bearishness, targeting the "Possible Bottom Zone" around 23,504.
---
Risk Management Tips for Options Trading:
- Limit your position size, especially near key resistance or support levels where reversals are more probable.
- In volatile market scenarios, consider using stop-loss orders based on hourly closes to avoid unnecessary stop-outs due to intraday volatility.
- Avoid entering trades in the "No Trade Zone" as highlighted on the chart, as these areas lack clear trend direction and increase the risk of whipsaw movements.
---
Summary & Conclusion:
For 13-Nov-2024, key levels to watch are 24,395 for resistance on the upside and 23,582 for critical support on the downside. Price action within the "Important Buyer’s Support" zone could dictate market direction. Green trends indicate potential bullish moves, Red trends signal bearish opportunities, and Yellow trends suggest caution with possible sideways action.
---
Disclaimer: I am not a SEBI-registered analyst. This analysis is based on my personal trading strategy and psychological theory. Please perform your analysis or consult a financial advisor before making any trading decisions.
---
Happy trading!

إخلاء المسؤولية
لا يُقصد بالمعلومات والمنشورات أن تكون، أو تشكل، أي نصيحة مالية أو استثمارية أو تجارية أو أنواع أخرى من النصائح أو التوصيات المقدمة أو المعتمدة من TradingView. اقرأ المزيد في شروط الاستخدام.
إخلاء المسؤولية
لا يُقصد بالمعلومات والمنشورات أن تكون، أو تشكل، أي نصيحة مالية أو استثمارية أو تجارية أو أنواع أخرى من النصائح أو التوصيات المقدمة أو المعتمدة من TradingView. اقرأ المزيد في شروط الاستخدام.