
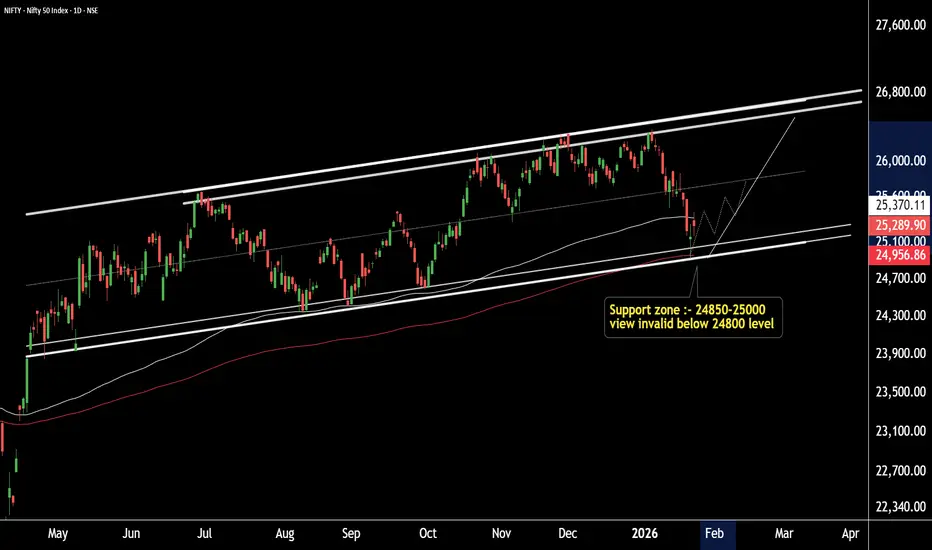
This is the daily timeframe chart of NIFTY.
NIFTY is showing strong support in the 24,850–24,950 zone. This zone is technically important due to multiple confirmations:
EMA support near 24,956
Fibonacci support near 24,938
Additionally, the channel support lies in the 24,850–25,050 range, strengthening the overall support structure.
On the upside, immediate resistance is seen around 25,500–25,700, while the next major resistance is placed near 26,400–26,500.
If this support zone holds, NIFTY is well-positioned for the next bullish move towards the mentioned resistance levels.
view invalid below 24800.
Thank you.
NIFTY is showing strong support in the 24,850–24,950 zone. This zone is technically important due to multiple confirmations:
EMA support near 24,956
Fibonacci support near 24,938
Additionally, the channel support lies in the 24,850–25,050 range, strengthening the overall support structure.
On the upside, immediate resistance is seen around 25,500–25,700, while the next major resistance is placed near 26,400–26,500.
If this support zone holds, NIFTY is well-positioned for the next bullish move towards the mentioned resistance levels.
view invalid below 24800.
Thank you.

@RahulSarawagi
Connect us at optionlab.co.in/
Connect us at optionlab.co.in/
إخلاء المسؤولية
لا يُقصد بالمعلومات والمنشورات أن تكون، أو تشكل، أي نصيحة مالية أو استثمارية أو تجارية أو أنواع أخرى من النصائح أو التوصيات المقدمة أو المعتمدة من TradingView. اقرأ المزيد في شروط الاستخدام.
@RahulSarawagi
Connect us at optionlab.co.in/
Connect us at optionlab.co.in/
إخلاء المسؤولية
لا يُقصد بالمعلومات والمنشورات أن تكون، أو تشكل، أي نصيحة مالية أو استثمارية أو تجارية أو أنواع أخرى من النصائح أو التوصيات المقدمة أو المعتمدة من TradingView. اقرأ المزيد في شروط الاستخدام.