
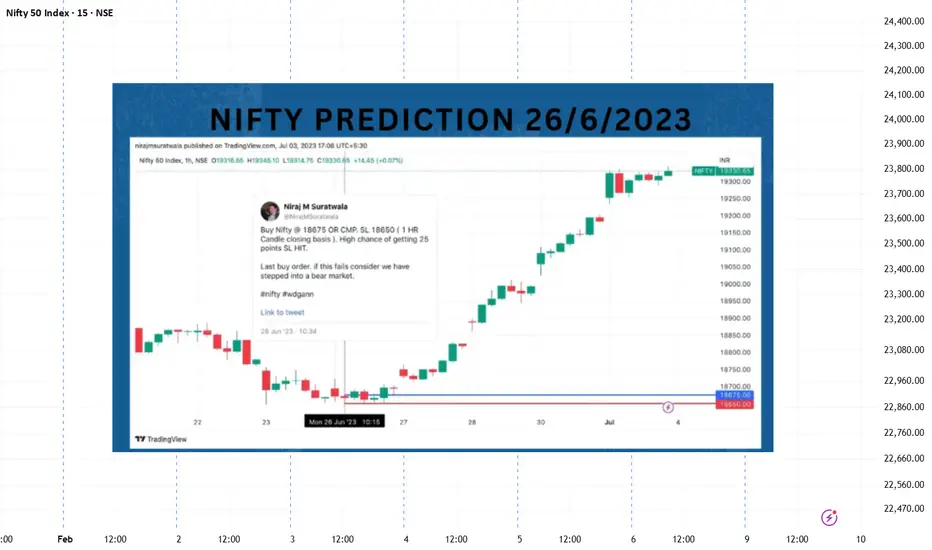
This idea presents a historical, educational chart study demonstrating how price–time structure can be analysed using classical WD Gann methodology.
⚠️ This is not a trade call, prediction, or investment advice.
📌 Market Background
In late June 2023, Nifty was trading near a previous structural price zone while broader sentiment remained cautious.
From a WD Gann perspective:
📊 What the Chart Illustrates
The chart highlights:
🧠 Educational Takeaways
⚠️ Disclaimer
This idea is posted for educational purposes only.
It does not constitute financial advice or future market recommendations.
⚠️ This is not a trade call, prediction, or investment advice.
📌 Market Background
In late June 2023, Nifty was trading near a previous structural price zone while broader sentiment remained cautious.
From a WD Gann perspective:
- Markets respond to pre-defined structural price levels
- Time plays a crucial role in validating support acceptance
- Strong trends often originate from well-aligned price–time zones
📊 What the Chart Illustrates
The chart highlights:
- A key reference support area derived from Gann structure
- Price behaviour around this zone over multiple sessions
- A subsequent price expansion phase after support validation
- This study is shared to explain how structure is observed, not to suggest trades.
🧠 Educational Takeaways
- WD Gann analysis focuses on structure first, direction later
- Support is validated through time + price behavior, not emotion
- Strong directional moves often begin from compressed structures
- Studying historical reactions improves future risk awareness
- This idea is meant purely for learning and methodological understanding.
⚠️ Disclaimer
This idea is posted for educational purposes only.
It does not constitute financial advice or future market recommendations.

منشورات ذات صلة
إخلاء المسؤولية
لا يُقصد بالمعلومات والمنشورات أن تكون، أو تشكل، أي نصيحة مالية أو استثمارية أو تجارية أو أنواع أخرى من النصائح أو التوصيات المقدمة أو المعتمدة من TradingView. اقرأ المزيد في شروط الاستخدام.
منشورات ذات صلة
إخلاء المسؤولية
لا يُقصد بالمعلومات والمنشورات أن تكون، أو تشكل، أي نصيحة مالية أو استثمارية أو تجارية أو أنواع أخرى من النصائح أو التوصيات المقدمة أو المعتمدة من TradingView. اقرأ المزيد في شروط الاستخدام.