
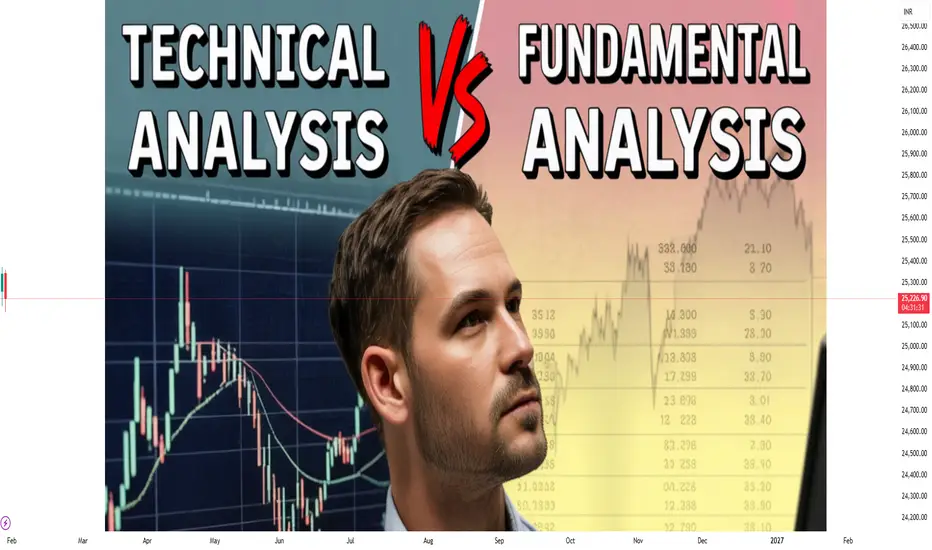
Introduction
In the world of investing and trading, understanding the value and timing of financial instruments is crucial. Investors and traders often rely on two primary methods to guide their decisions: technical analysis and fundamental analysis. While both aim to inform decisions about buying, holding, or selling securities, they differ fundamentally in approach, methodology, and application. Understanding the strengths, limitations, and appropriate use cases of each is vital for anyone participating in financial markets.
1. Fundamental Analysis
Fundamental analysis focuses on evaluating a security’s intrinsic value. It attempts to determine whether a stock, bond, or other asset is overvalued, undervalued, or fairly priced based on the underlying economic and financial factors.
1.1 Core Principles
At its core, fundamental analysis is about understanding the “health” of a company or asset. Analysts examine various factors, including:
Financial Statements: Income statements, balance sheets, and cash flow statements are analyzed to assess profitability, liquidity, solvency, and efficiency. Key metrics include earnings per share (EPS), price-to-earnings (P/E) ratio, debt-to-equity ratio, and return on equity (ROE).
Industry Conditions: The sector in which a company operates affects its potential. Market share, competitive advantages, regulatory environment, and industry growth trends are critical considerations.
Macroeconomic Factors: Interest rates, inflation, GDP growth, and fiscal policies can significantly influence asset prices.
Management Quality: Leadership decisions, corporate governance, and strategic vision often determine long-term success.
1.2 Methods
There are two primary approaches to fundamental analysis:
Top-Down Approach: Analysts first study macroeconomic conditions, then industry trends, and finally specific companies.
Bottom-Up Approach: Focuses on analyzing individual companies, often ignoring broader economic conditions, to identify investment opportunities.
1.3 Example
Suppose an investor evaluates Company X, a technology firm. By analyzing its revenue growth, profit margins, R&D spending, and competitive position, the investor determines the intrinsic value of the stock to be $150. If the current market price is $120, the stock may be considered undervalued, presenting a potential buying opportunity.
1.4 Advantages of Fundamental Analysis
Long-Term Perspective: Helps investors identify securities that may generate sustainable returns over years.
Value Identification: Can reveal undervalued or overvalued assets relative to intrinsic value.
Economic Insight: Offers a comprehensive understanding of industry and macroeconomic impacts on investments.
1.5 Limitations of Fundamental Analysis
Time-Consuming: Requires deep research, data collection, and analysis.
Subjectivity: Estimating intrinsic value involves assumptions that may differ among analysts.
Less Effective for Short-Term Trading: Market prices may diverge from fundamental values for extended periods.
2. Technical Analysis
Technical analysis, on the other hand, focuses on price movements and trading patterns rather than the underlying business. It assumes that all relevant information is already reflected in the asset’s price, and that historical patterns tend to repeat over time.
2.1 Core Principles
Technical analysis is based on three key assumptions:
Market Action Discounts Everything: Prices reflect all available information, including fundamentals, market sentiment, and news.
Prices Move in Trends: Once established, trends are more likely to continue than reverse, at least until proven otherwise.
History Tends to Repeat Itself: Human psychology leads to recurring price patterns.
2.2 Tools and Techniques
Technical analysts use charts, patterns, and indicators to forecast price movements:
Charts: Line charts, bar charts, and candlestick charts visualize price action over different time frames.
Indicators: Moving averages, relative strength index (RSI), MACD, Bollinger Bands, and Fibonacci retracement levels help identify trends and momentum.
Patterns: Head-and-shoulders, double tops/bottoms, triangles, and flags signal potential reversals or continuations.
Volume Analysis: Helps confirm trends or warn of potential reversals.
2.3 Example
A trader observes that Stock Y has formed a “double bottom” pattern on its daily chart, signaling a potential upward reversal. Using this information, the trader may enter a long position, anticipating a price increase based on historical pattern behavior rather than the company’s earnings or fundamentals.
2.4 Advantages of Technical Analysis
Timing and Short-Term Opportunities: Helps traders make decisions based on market trends and entry/exit points.
Quantitative Approach: Uses measurable price data and mathematical indicators.
Market Sentiment Insight: Captures emotions and behaviors that drive short-term price movements.
2.5 Limitations of Technical Analysis
Does Not Measure Intrinsic Value: Focuses purely on price action without regard to a company’s financial health.
False Signals: Patterns and indicators can fail, leading to losses.
Short-Term Focus: Often unsuitable for long-term investment strategies.
3. Fundamental vs. Technical Analysis: Key Differences
Feature Fundamental Analysis Technical Analysis
Focus Intrinsic value of the asset Price movements and trends
Time Horizon Long-term Short- to medium-term
Basis Financial statements, economic indicators, industry trends Price charts, volume, technical indicators
Assumption Market prices eventually reflect true value History tends to repeat; price trends continue
Tools Ratios, financial models, macroeconomic data Charts, trend lines, moving averages, oscillators
Decision Making Buy undervalued, sell overvalued Buy when patterns signal upward trend, sell on reversal signals
Use Case Investment (long-term) Trading (short-term or swing trading)
4. Integrating Both Approaches
Many successful investors and traders combine both fundamental and technical analysis:
Long-Term Investors: Use fundamental analysis to identify undervalued stocks, then apply technical analysis to optimize entry points.
Swing Traders: May rely primarily on technical analysis but consider fundamental news (earnings, economic data) to anticipate volatility.
Portfolio Management: Combining both can improve risk management and timing of trades.
Example of Integration
Consider a tech company showing strong earnings growth (fundamental analysis). A technical analyst may wait for a price breakout above a resistance level before entering a trade. By combining both approaches, the investor aligns value with optimal timing.
5. Market Psychology and Behavioral Insights
Fundamental Analysis: Relies on rational evaluation of financial health, assuming markets are logical over the long term.
Technical Analysis: Captures human psychology, fear, and greed, which often dominate short-term market behavior.
This difference reflects the broader tension between value investing and trend trading. Technical analysis often thrives in volatile, sentiment-driven markets, whereas fundamental analysis provides a grounded assessment during stable, growth-oriented periods.
6. Conclusion
Both fundamental and technical analysis offer valuable insights, but they serve different purposes. Fundamental analysis is ideal for long-term investors seeking intrinsic value, focusing on company performance, industry trends, and economic conditions. Technical analysis suits short-term traders aiming to exploit market trends and price patterns, focusing on timing and market sentiment.
While some purists favor one approach over the other, the most successful market participants often blend the two. Fundamental analysis provides the “why” behind an investment, while technical analysis provides the “when.” By understanding the strengths and limitations of each method, investors and traders can make more informed, strategic, and disciplined financial decisions.
In today’s dynamic financial markets, a holistic approach that considers both fundamentals and technical signals can enhance profitability, reduce risk, and provide a robust framework for navigating complexity. Knowledge of both allows market participants to adapt to changing conditions, combine long-term insight with short-term strategy, and ultimately make more confident decisions in the face of uncertainty.

منشورات ذات صلة
إخلاء المسؤولية
لا يُقصد بالمعلومات والمنشورات أن تكون، أو تشكل، أي نصيحة مالية أو استثمارية أو تجارية أو أنواع أخرى من النصائح أو التوصيات المقدمة أو المعتمدة من TradingView. اقرأ المزيد في شروط الاستخدام.
منشورات ذات صلة
إخلاء المسؤولية
لا يُقصد بالمعلومات والمنشورات أن تكون، أو تشكل، أي نصيحة مالية أو استثمارية أو تجارية أو أنواع أخرى من النصائح أو التوصيات المقدمة أو المعتمدة من TradingView. اقرأ المزيد في شروط الاستخدام.