
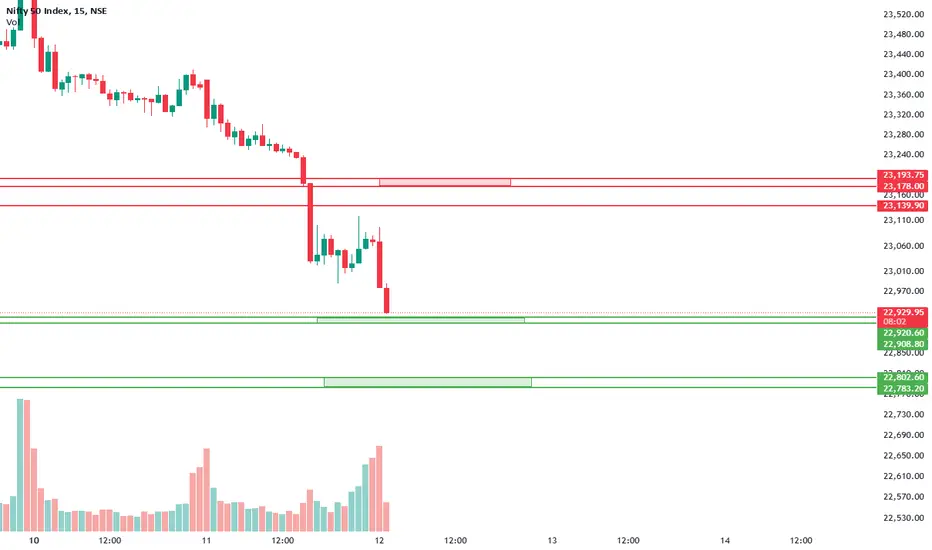
This chart shows support (green levels) and resistance (red levels):
Analysis of the Chart
Resistance Levels (Red)
1 . 23,139.90
2. 23,178.00 - 23,193.75
Support Levels (Green)
The price is currently testing support at around 22,929.95 - 22,920.60.
If this support holds, we may see a bounce back up.
If this level breaks, the price could fall to the next support zone at 22,802.60 - 22,783.20.
Analysis of the Chart
Resistance Levels (Red)
1 . 23,139.90
2. 23,178.00 - 23,193.75
Support Levels (Green)
The price is currently testing support at around 22,929.95 - 22,920.60.
If this support holds, we may see a bounce back up.
If this level breaks, the price could fall to the next support zone at 22,802.60 - 22,783.20.

إخلاء المسؤولية
لا يُقصد بالمعلومات والمنشورات أن تكون، أو تشكل، أي نصيحة مالية أو استثمارية أو تجارية أو أنواع أخرى من النصائح أو التوصيات المقدمة أو المعتمدة من TradingView. اقرأ المزيد في شروط الاستخدام.
إخلاء المسؤولية
لا يُقصد بالمعلومات والمنشورات أن تكون، أو تشكل، أي نصيحة مالية أو استثمارية أو تجارية أو أنواع أخرى من النصائح أو التوصيات المقدمة أو المعتمدة من TradingView. اقرأ المزيد في شروط الاستخدام.