
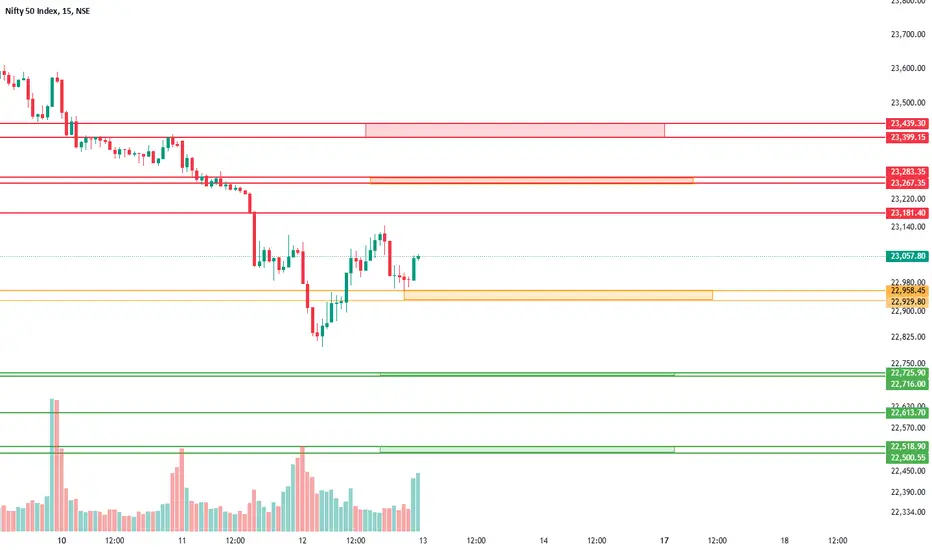
Above the yellow zone → Bullish momentum is likely, meaning the price may rise toward the red resistance zones.
Below the yellow zone → Bears might take control, pushing the price toward the green support zones.
Green zones → Strong support levels, where price could bounce.
Red zones → Resistance levels, where price might face selling pressure.
Below the yellow zone → Bears might take control, pushing the price toward the green support zones.
Green zones → Strong support levels, where price could bounce.
Red zones → Resistance levels, where price might face selling pressure.

منشورات ذات صلة
إخلاء المسؤولية
لا يُقصد بالمعلومات والمنشورات أن تكون، أو تشكل، أي نصيحة مالية أو استثمارية أو تجارية أو أنواع أخرى من النصائح أو التوصيات المقدمة أو المعتمدة من TradingView. اقرأ المزيد في شروط الاستخدام.
منشورات ذات صلة
إخلاء المسؤولية
لا يُقصد بالمعلومات والمنشورات أن تكون، أو تشكل، أي نصيحة مالية أو استثمارية أو تجارية أو أنواع أخرى من النصائح أو التوصيات المقدمة أو المعتمدة من TradingView. اقرأ المزيد في شروط الاستخدام.