
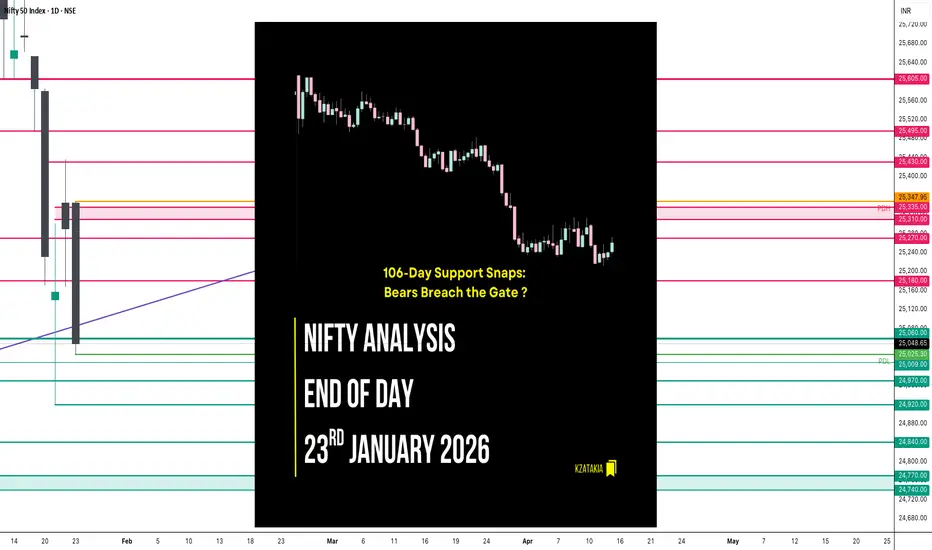
🟢 Nifty Analysis EOD – January 23, 2026 – Friday 🔴
106-Day Support Snaps: Bears Breach the Gate ?
🗞 Nifty Summary
The Nifty started with a mild 27-point Gap Up, entering a high-voltage battle zone between 25,250 ~ 25,350. This 100-point range saw wild intraday swings that trapped both sides before a clear direction emerged.
At 11:35 AM, the bulls finally gave up, leading to a decisive IB Low breakout. The bearish sentiment accelerated as the PDL (Previous Day Low) was breached at 1:15 PM.
Despite a brief attempt to hold the 25,180 level, the index plummeted to its “last resort” support of 25,060, closing the session at 25,048.65 (-0.95%). This marks the lowest close in 72 sessions (106 days), dragging the index back to levels last seen on October 8, 2025.
🛡 5 Min Intraday Chart with Levels

🛡 Intraday Walk
Today was a session of systematic distribution.
The morning’s 100-point “tug-of-war” served as a distribution phase before the floodgates opened. Once the 25,250 floor was lost, the slide was relentless.
The most significant technical event was the daily close below the channel’s bottom band. While the Jan 21 low of 24,920 still stands as the final line of defense, today’s close has significantly weakened the reversal thesis, shifting the focus toward a potential bearish continuation.
📉 Daily Time Frame Chart with Intraday Levels

🕯 Daily Candle Breakdown
Open: 25,344.60
High: 25,347.95
Low: 25,025.30
Close: 25,048.65
Change: -241.25 (-0.95%)
🏗️ Structure Breakdown
Type: Strong Bearish candle (Marubozu-style).
Range: ≈ 323 points — High intraday volatility.
Body: ≈ 296 points — Aggressive, unchecked selling pressure.
Upper Wick: ≈ 3 points — Absolute lack of buying strength at the open.
Lower Wick: ≈ 23 points — Minimal demand even at the extreme lows.
📚 Interpretation
This is a high-conviction Bearish Breakdown candle. Opening at the day’s high and closing near the day’s low suggests that the market is in a “Sell on Rise” mode. The breach of the 106-day closing low indicates that the medium-term trend has been severely damaged, and the previous recovery attempts are being invalidated.
🕯 Candle Type
Bearish Marubozu-Style / Breakdown Candle — Signals powerful downside momentum; further weakness is expected unless the index reclaims the channel bottom immediately.
🛡 5 Min Intraday Chart

⚔️ Gladiator Strategy Update
ATR: 256.30
IB Range: 98.85 → Medium
Market Structure: Balanced
Trade Highlights:
10:18 Long Trade: SL Hit (Caught in the morning battle whipsaw).
11:38 Short Trade: Target Hit (R:R 1:1.73) (IBL Breakout).
13:16 Short Trade: Target Hit (R:R 1:3.03) (PDL Breakout).
Trade Summary: A disciplined performance despite the early stop-loss. The strategy correctly pivoted to the short side as the balance shifted. The PDL breakout trade was the star of the session, capturing the vertical drop to the 25,060 support zone with a strong 1:3.03 R:R.
🧱 Support & Resistance Levels
Resistance Zones:
25180
25270
25310 ~ 25335
25430
Support Zones:
25025 ~ 25000
24970
24920 (Critical Floor)
24840
24770 ~ 24740
🧠 Final Thoughts
“The 24,920 level is now the only shield left.”
The daily close below the channel is a major red flag.
If the 24,920 low is breached in the upcoming sessions, the bullish reversal sign from January 21 will be completely negated.
At that point, the structure will confirm a bearish continuation with targets shifting toward the 24,600 ~ 24,400 zone. Until then, expect the bears to maintain their grip, using every minor bounce as a supply window.
✏️ Disclaimer
This is just my personal viewpoint. Always consult your financial advisor before taking any action.
106-Day Support Snaps: Bears Breach the Gate ?
🗞 Nifty Summary
The Nifty started with a mild 27-point Gap Up, entering a high-voltage battle zone between 25,250 ~ 25,350. This 100-point range saw wild intraday swings that trapped both sides before a clear direction emerged.
At 11:35 AM, the bulls finally gave up, leading to a decisive IB Low breakout. The bearish sentiment accelerated as the PDL (Previous Day Low) was breached at 1:15 PM.
Despite a brief attempt to hold the 25,180 level, the index plummeted to its “last resort” support of 25,060, closing the session at 25,048.65 (-0.95%). This marks the lowest close in 72 sessions (106 days), dragging the index back to levels last seen on October 8, 2025.
🛡 5 Min Intraday Chart with Levels
🛡 Intraday Walk
Today was a session of systematic distribution.
The morning’s 100-point “tug-of-war” served as a distribution phase before the floodgates opened. Once the 25,250 floor was lost, the slide was relentless.
The most significant technical event was the daily close below the channel’s bottom band. While the Jan 21 low of 24,920 still stands as the final line of defense, today’s close has significantly weakened the reversal thesis, shifting the focus toward a potential bearish continuation.
📉 Daily Time Frame Chart with Intraday Levels
🕯 Daily Candle Breakdown
Open: 25,344.60
High: 25,347.95
Low: 25,025.30
Close: 25,048.65
Change: -241.25 (-0.95%)
🏗️ Structure Breakdown
Type: Strong Bearish candle (Marubozu-style).
Range: ≈ 323 points — High intraday volatility.
Body: ≈ 296 points — Aggressive, unchecked selling pressure.
Upper Wick: ≈ 3 points — Absolute lack of buying strength at the open.
Lower Wick: ≈ 23 points — Minimal demand even at the extreme lows.
📚 Interpretation
This is a high-conviction Bearish Breakdown candle. Opening at the day’s high and closing near the day’s low suggests that the market is in a “Sell on Rise” mode. The breach of the 106-day closing low indicates that the medium-term trend has been severely damaged, and the previous recovery attempts are being invalidated.
🕯 Candle Type
Bearish Marubozu-Style / Breakdown Candle — Signals powerful downside momentum; further weakness is expected unless the index reclaims the channel bottom immediately.
🛡 5 Min Intraday Chart
⚔️ Gladiator Strategy Update
ATR: 256.30
IB Range: 98.85 → Medium
Market Structure: Balanced
Trade Highlights:
10:18 Long Trade: SL Hit (Caught in the morning battle whipsaw).
11:38 Short Trade: Target Hit (R:R 1:1.73) (IBL Breakout).
13:16 Short Trade: Target Hit (R:R 1:3.03) (PDL Breakout).
Trade Summary: A disciplined performance despite the early stop-loss. The strategy correctly pivoted to the short side as the balance shifted. The PDL breakout trade was the star of the session, capturing the vertical drop to the 25,060 support zone with a strong 1:3.03 R:R.
🧱 Support & Resistance Levels
Resistance Zones:
25180
25270
25310 ~ 25335
25430
Support Zones:
25025 ~ 25000
24970
24920 (Critical Floor)
24840
24770 ~ 24740
🧠 Final Thoughts
“The 24,920 level is now the only shield left.”
The daily close below the channel is a major red flag.
If the 24,920 low is breached in the upcoming sessions, the bullish reversal sign from January 21 will be completely negated.
At that point, the structure will confirm a bearish continuation with targets shifting toward the 24,600 ~ 24,400 zone. Until then, expect the bears to maintain their grip, using every minor bounce as a supply window.
✏️ Disclaimer
This is just my personal viewpoint. Always consult your financial advisor before taking any action.

Read my blogs here:
substack.com/@kzatakia
Follow me on Telegram:
t.me/swingtraderhub
Follow me on X:
x.com/kzatakia
substack.com/@kzatakia
Follow me on Telegram:
t.me/swingtraderhub
Follow me on X:
x.com/kzatakia
منشورات ذات صلة
إخلاء المسؤولية
لا يُقصد بالمعلومات والمنشورات أن تكون، أو تشكل، أي نصيحة مالية أو استثمارية أو تجارية أو أنواع أخرى من النصائح أو التوصيات المقدمة أو المعتمدة من TradingView. اقرأ المزيد في شروط الاستخدام.
Read my blogs here:
substack.com/@kzatakia
Follow me on Telegram:
t.me/swingtraderhub
Follow me on X:
x.com/kzatakia
substack.com/@kzatakia
Follow me on Telegram:
t.me/swingtraderhub
Follow me on X:
x.com/kzatakia
منشورات ذات صلة
إخلاء المسؤولية
لا يُقصد بالمعلومات والمنشورات أن تكون، أو تشكل، أي نصيحة مالية أو استثمارية أو تجارية أو أنواع أخرى من النصائح أو التوصيات المقدمة أو المعتمدة من TradingView. اقرأ المزيد في شروط الاستخدام.