
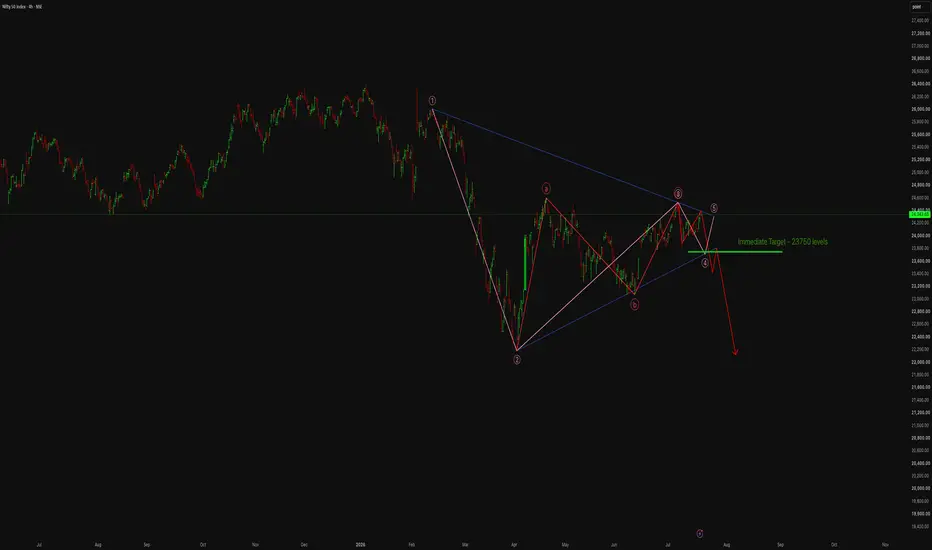
## NIFTY 50 – 4-Hour Chart Analysis
1. Nifty is trading inside a **large symmetrical triangle**, indicating a period of consolidation where buyers and sellers are preparing for the next major directional move.
2. Price is currently approaching the **upper trendline resistance near 24,350–24,400**, a zone where multiple previous rejections have occurred, making it a crucial resistance level.
3. The Elliott Wave structure suggests that **Wave (5)** of the corrective rally is nearing completion, increasing the probability of a short-term reversal.
4. The chart indicates an **ABC corrective pattern** has likely completed, and failure to break above the triangle resistance could trigger a fresh bearish impulse.
5. The immediate support is around **23,750**, which is also highlighted on the chart as the first downside target after a breakdown.
6. A decisive close below **23,750** would confirm the breakdown from the triangle and could accelerate selling towards **23,200–22,900**.
7. The lower ascending trendline has supported prices several times, but repeated tests generally weaken support, increasing the probability of an eventual breakdown.
8. A sustained breakout above **24,400** with strong volume would invalidate the bearish setup and could lead to a rally towards **24,700–25,000**.
9. Traders should closely monitor the **24,350–24,400 resistance** and **23,750 support**, as a breakout from either level is likely to determine the next medium-term trend.
10. **Overall Outlook: Moderately Bearish (7.5/10)** with the expected path: **24,340 → 24,400 (Resistance) → 23,750 → 23,200 → 22,900**, while **24,400** remains the key breakout and invalidation level.
---
### Disclaimer
> **Disclaimer:** This analysis is based on technical indicators, Elliott Wave interpretation, chart patterns, trendline analysis, support and resistance levels, and the current market structure. It is intended **solely for educational and informational purposes** and **should not be considered financial or investment advice**. Financial markets are inherently volatile, and no technical analysis can guarantee future price movements. Please conduct your own research and consult a qualified financial advisor before making any investment or trading decisions.

إخلاء المسؤولية
لا يُقصد بالمعلومات والمنشورات أن تكون، أو تشكل، أي نصيحة مالية أو استثمارية أو تجارية أو أنواع أخرى من النصائح أو التوصيات المقدمة أو المعتمدة من TradingView. اقرأ المزيد في شروط الاستخدام.
إخلاء المسؤولية
لا يُقصد بالمعلومات والمنشورات أن تكون، أو تشكل، أي نصيحة مالية أو استثمارية أو تجارية أو أنواع أخرى من النصائح أو التوصيات المقدمة أو المعتمدة من TradingView. اقرأ المزيد في شروط الاستخدام.