
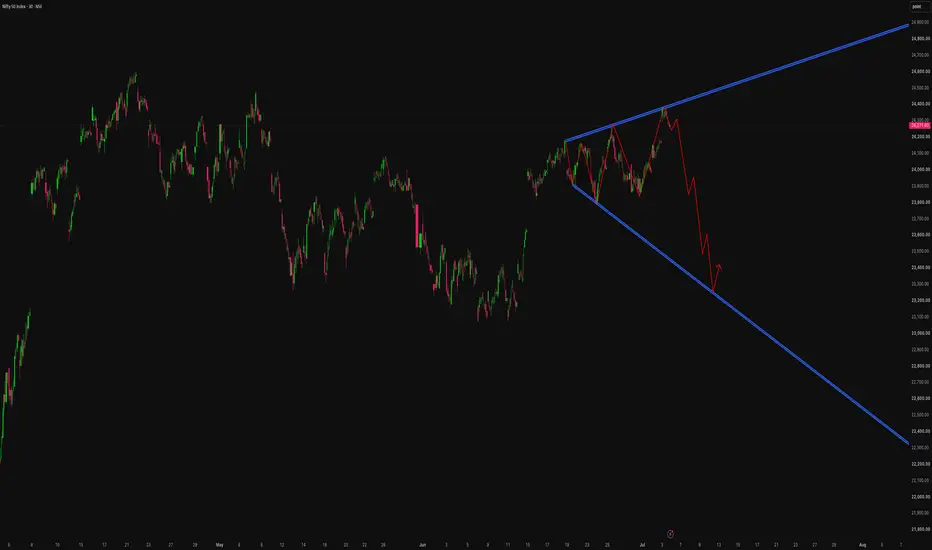
## NIFTY 50 – 30-Minute Chart Analysis
1. Nifty is currently trading inside a **rising broadening wedge**, a pattern that often signals increasing volatility and carries a bearish bias after an extended uptrend.
2. Price is approaching the **upper boundary of the wedge near 24,350–24,400**, which represents a critical resistance zone where sellers may become active.
3. Multiple rejections from the upper trendline indicate that **bullish momentum is weakening**, despite the series of higher highs.
4. If Nifty fails to break and sustain above the upper trendline, the chart suggests a **sharp corrective decline** toward the lower boundary of the wedge.
5. The first support is expected around **24,000**, followed by **23,700**, where buyers may attempt to stabilize the market.
6. A decisive breakdown below the lower wedge trendline could accelerate selling pressure, exposing the **23,300–23,200** zone as the next major downside target.
7. On the bullish side, a strong close above **24,400** with increased volume would invalidate the bearish setup and could trigger a fresh breakout toward new all-time highs.
8. Until a confirmed breakout occurs, rallies into the **24,350–24,400** resistance zone should be treated cautiously, as they may present profit-booking opportunities.
9. Traders should closely monitor price action near the upper trendline, as confirmation from rejection or breakout will likely determine the next directional move.
10. **Overall Outlook: Moderately Bearish (7.5/10)** with the expected path: **24,270 → 24,380 (Resistance) → 24,000 → 23,700 → 23,300**, unless Nifty closes decisively above **24,400**.
---
### Disclaimer
> **Disclaimer:** This analysis is based on technical indicators, chart patterns, Elliott Wave interpretation, trendline analysis, and the current market structure. It is intended **solely for educational and informational purposes** and **should not be considered financial or investment advice**. Financial markets are inherently volatile, and no technical analysis can guarantee future price movements. Please conduct your own research and consult a qualified financial advisor before making any investment or trading decisions.
1. Nifty is currently trading inside a **rising broadening wedge**, a pattern that often signals increasing volatility and carries a bearish bias after an extended uptrend.
2. Price is approaching the **upper boundary of the wedge near 24,350–24,400**, which represents a critical resistance zone where sellers may become active.
3. Multiple rejections from the upper trendline indicate that **bullish momentum is weakening**, despite the series of higher highs.
4. If Nifty fails to break and sustain above the upper trendline, the chart suggests a **sharp corrective decline** toward the lower boundary of the wedge.
5. The first support is expected around **24,000**, followed by **23,700**, where buyers may attempt to stabilize the market.
6. A decisive breakdown below the lower wedge trendline could accelerate selling pressure, exposing the **23,300–23,200** zone as the next major downside target.
7. On the bullish side, a strong close above **24,400** with increased volume would invalidate the bearish setup and could trigger a fresh breakout toward new all-time highs.
8. Until a confirmed breakout occurs, rallies into the **24,350–24,400** resistance zone should be treated cautiously, as they may present profit-booking opportunities.
9. Traders should closely monitor price action near the upper trendline, as confirmation from rejection or breakout will likely determine the next directional move.
10. **Overall Outlook: Moderately Bearish (7.5/10)** with the expected path: **24,270 → 24,380 (Resistance) → 24,000 → 23,700 → 23,300**, unless Nifty closes decisively above **24,400**.
---
### Disclaimer
> **Disclaimer:** This analysis is based on technical indicators, chart patterns, Elliott Wave interpretation, trendline analysis, and the current market structure. It is intended **solely for educational and informational purposes** and **should not be considered financial or investment advice**. Financial markets are inherently volatile, and no technical analysis can guarantee future price movements. Please conduct your own research and consult a qualified financial advisor before making any investment or trading decisions.

إخلاء المسؤولية
لا يُقصد بالمعلومات والمنشورات أن تكون، أو تشكل، أي نصيحة مالية أو استثمارية أو تجارية أو أنواع أخرى من النصائح أو التوصيات المقدمة أو المعتمدة من TradingView. اقرأ المزيد في شروط الاستخدام.
إخلاء المسؤولية
لا يُقصد بالمعلومات والمنشورات أن تكون، أو تشكل، أي نصيحة مالية أو استثمارية أو تجارية أو أنواع أخرى من النصائح أو التوصيات المقدمة أو المعتمدة من TradingView. اقرأ المزيد في شروط الاستخدام.