
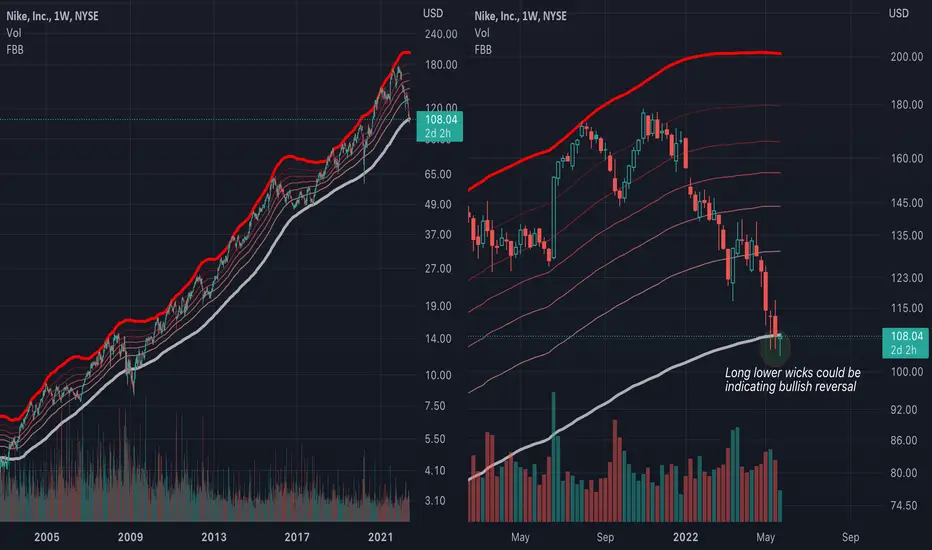
Just an observation: Nike (NKE) is currently sitting on the Fibonacci Bollinger Band (FBB) plot line that has generally acted as support for the past 20 years. The weekly candles are printing long lower wicks which could suggest a bullish reversal is building along this line. The yearly chart is not overextended and fitting perfectly on multiple linear log trend lines that stretch back decades. Seems like a warning to those who are selling or shorting Nike at this level. Anyone feel differently?
Not financial advice.
Not financial advice.

إخلاء المسؤولية
لا يُقصد بالمعلومات والمنشورات أن تكون، أو تشكل، أي نصيحة مالية أو استثمارية أو تجارية أو أنواع أخرى من النصائح أو التوصيات المقدمة أو المعتمدة من TradingView. اقرأ المزيد في شروط الاستخدام.
إخلاء المسؤولية
لا يُقصد بالمعلومات والمنشورات أن تكون، أو تشكل، أي نصيحة مالية أو استثمارية أو تجارية أو أنواع أخرى من النصائح أو التوصيات المقدمة أو المعتمدة من TradingView. اقرأ المزيد في شروط الاستخدام.