شراء
$NWHM Forming 3 Month #AscendingTriangle #ChartPattern
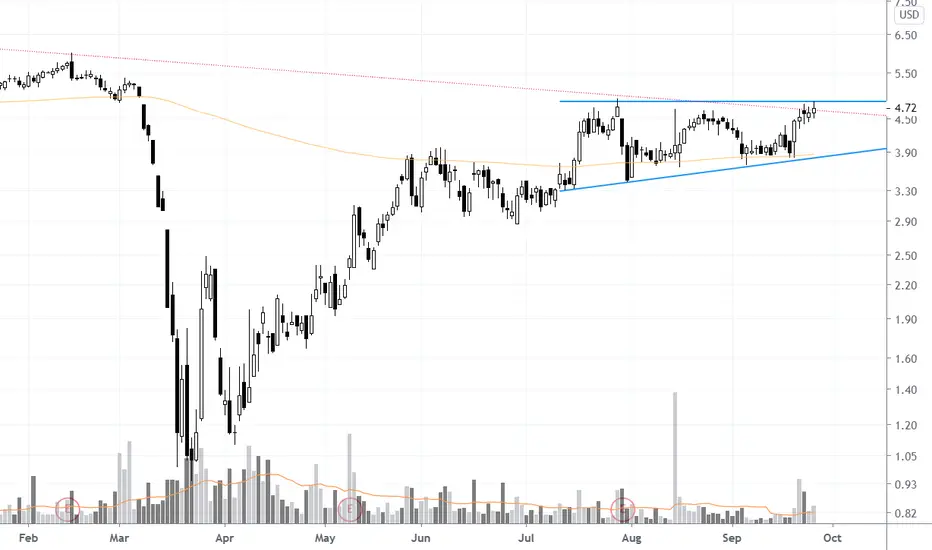
With the market selling off the last 3 weeks, $NYSE:NWHM been showing relative strength trading sideways to up. The stock has formed an ascending triangle chart pattern with upper boundary around $4.85 acting as resistance. The stock spent the last 4 sessions trading just under that level. The stock is also breaking a long weekly down trendline (red line on the chart), adding to the importance a possible chart pattern breakout.
Volume pattern also showing buying interest and the stock could be ready to breakout early this week. Buy a daily close about chart patter upper boundary for a possible leg higher.
Volume pattern also showing buying interest and the stock could be ready to breakout early this week. Buy a daily close about chart patter upper boundary for a possible leg higher.
ملاحظة
broke out on good volume today and i posted a breakout mode post. please follow that one for updates. i won't be updating this post anymore.
✔ Momentum & Breakout Trader Since 2006 | Influenced by Mark Minervini VCP Trading Style & William O'Neil CANSLIM 📈
✔ Follow me on Twitter @taplot - twitter.com/TaPlot
✔ YouTube channel youtube.com/@taplot
✔ Follow me on Twitter @taplot - twitter.com/TaPlot
✔ YouTube channel youtube.com/@taplot
إخلاء المسؤولية
لا يُقصد بالمعلومات والمنشورات أن تكون، أو تشكل، أي نصيحة مالية أو استثمارية أو تجارية أو أنواع أخرى من النصائح أو التوصيات المقدمة أو المعتمدة من TradingView. اقرأ المزيد في شروط الاستخدام.
✔ Momentum & Breakout Trader Since 2006 | Influenced by Mark Minervini VCP Trading Style & William O'Neil CANSLIM 📈
✔ Follow me on Twitter @taplot - twitter.com/TaPlot
✔ YouTube channel youtube.com/@taplot
✔ Follow me on Twitter @taplot - twitter.com/TaPlot
✔ YouTube channel youtube.com/@taplot
إخلاء المسؤولية
لا يُقصد بالمعلومات والمنشورات أن تكون، أو تشكل، أي نصيحة مالية أو استثمارية أو تجارية أو أنواع أخرى من النصائح أو التوصيات المقدمة أو المعتمدة من TradingView. اقرأ المزيد في شروط الاستخدام.