

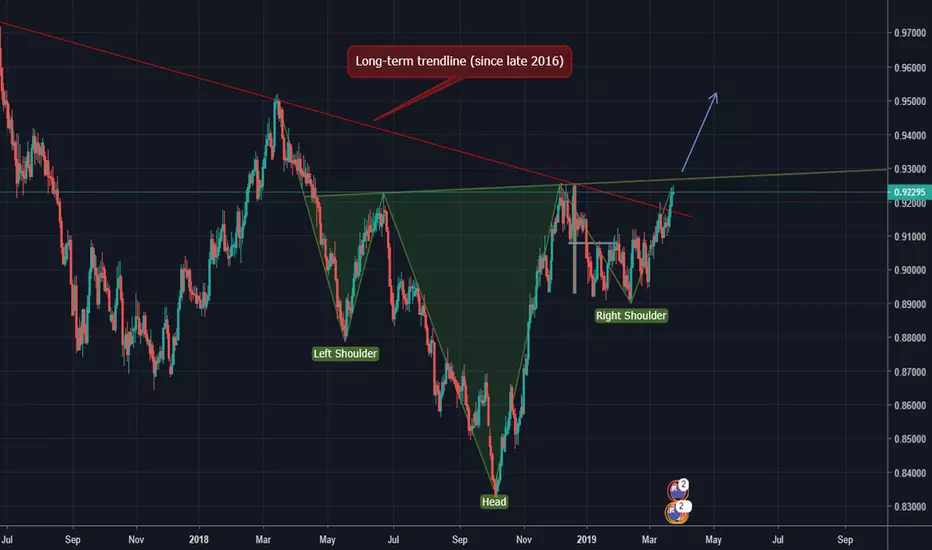
The NZDCAD pair broke above a long-term trendline which has started in late 2016 and formed what looks like an inverse SHS pattern.
A daily close above 0.9300 would mark the pattern as triggered and confirm a buy setup.
This week's RBNZ rate meeting will likely create volatility in NZD pairs and either confirm our bullish bias or put the trade on hold.
Like our analysis? Please hit the "Like" button and let us know your views in the comment section.
Join us on Telegram -> t.me/CommaFX
A daily close above 0.9300 would mark the pattern as triggered and confirm a buy setup.
This week's RBNZ rate meeting will likely create volatility in NZD pairs and either confirm our bullish bias or put the trade on hold.
Like our analysis? Please hit the "Like" button and let us know your views in the comment section.
Join us on Telegram -> t.me/CommaFX

منشورات ذات صلة
إخلاء المسؤولية
لا يُقصد بالمعلومات والمنشورات أن تكون، أو تشكل، أي نصيحة مالية أو استثمارية أو تجارية أو أنواع أخرى من النصائح أو التوصيات المقدمة أو المعتمدة من TradingView. اقرأ المزيد في شروط الاستخدام.
منشورات ذات صلة
إخلاء المسؤولية
لا يُقصد بالمعلومات والمنشورات أن تكون، أو تشكل، أي نصيحة مالية أو استثمارية أو تجارية أو أنواع أخرى من النصائح أو التوصيات المقدمة أو المعتمدة من TradingView. اقرأ المزيد في شروط الاستخدام.