
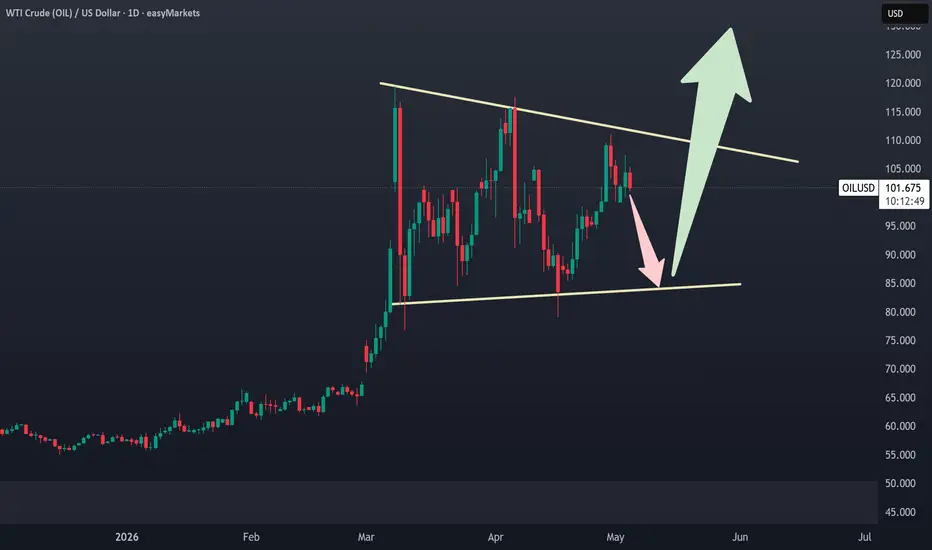
WTI Crude Oil is currently forming a well-defined symmetrical triangle on the daily timeframe, indicating a period of consolidation after a strong impulsive move. Price action is tightening between a descending resistance trendline and an ascending support trendline, showing clear compression as volatility declines.
This type of structure typically precedes a significant breakout, as the market builds pressure within the range. While the prior trend was bullish — giving a slight edge to an upside continuation — confirmation is still required before taking a directional bias.
🔑 Key levels to watch:
• Resistance zone: 110–115
• Support zone: 84–88
📈 Bullish case:
A strong daily close above resistance, followed by a successful retest, could open the path above 120.
⚠️ Important notes:
• Price is currently in the middle of the range — not an optimal trade location
This type of structure typically precedes a significant breakout, as the market builds pressure within the range. While the prior trend was bullish — giving a slight edge to an upside continuation — confirmation is still required before taking a directional bias.
🔑 Key levels to watch:
• Resistance zone: 110–115
• Support zone: 84–88
📈 Bullish case:
A strong daily close above resistance, followed by a successful retest, could open the path above 120.
⚠️ Important notes:
• Price is currently in the middle of the range — not an optimal trade location

منشورات ذات صلة
إخلاء المسؤولية
لا يُقصد بالمعلومات والمنشورات أن تكون، أو تشكل، أي نصيحة مالية أو استثمارية أو تجارية أو أنواع أخرى من النصائح أو التوصيات المقدمة أو المعتمدة من TradingView. اقرأ المزيد في شروط الاستخدام.
إخلاء المسؤولية
لا يُقصد بالمعلومات والمنشورات أن تكون، أو تشكل، أي نصيحة مالية أو استثمارية أو تجارية أو أنواع أخرى من النصائح أو التوصيات المقدمة أو المعتمدة من TradingView. اقرأ المزيد في شروط الاستخدام.