
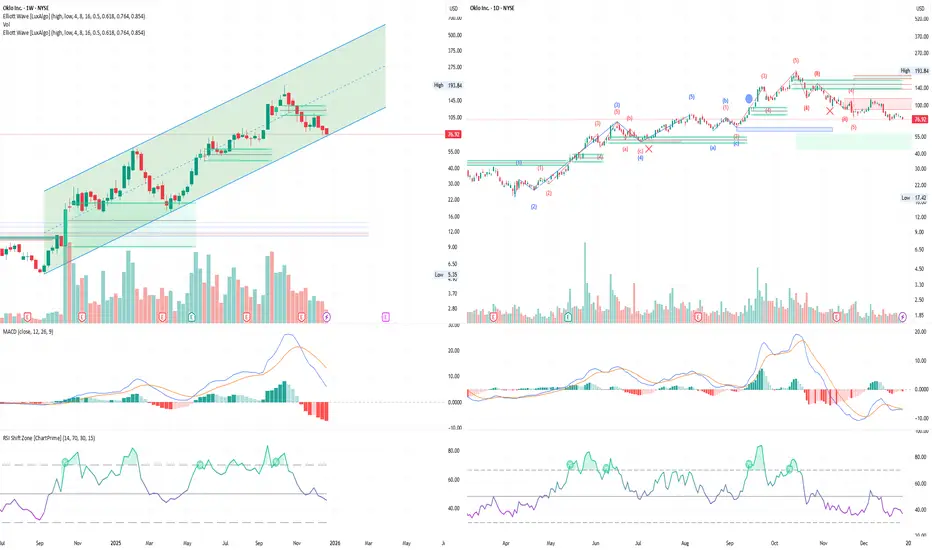
Oklo remains in a long-term uptrend, but current price action shows growing downside pressure. On the weekly chart, price has pulled back from the highs near $190–195 and is now trading around $76–77, placing it in the lower half of a well-defined rising channel. The lower channel boundary currently comes in around $70–72, making this zone a key area of structural support.
Weekly momentum confirms the corrective phase. Weekly MACD has crossed lower and continues to expand to the downside, signaling sustained selling pressure. Weekly RSI has fallen from overbought levels above 70 and is now sitting near 45–48. This level suggests momentum has cooled but has not yet reached oversold conditions, leaving room for either further downside or sideways consolidation before a meaningful bounce.
The daily chart highlights more visible weakness. After topping near $190, Oklo transitioned into a clear sequence of lower highs and lower lows. Former support between $85–95 has failed and now acts as overhead resistance. Price is currently consolidating just above $75, a level that aligns with prior demand and the weekly channel support.
Daily MACD remains negative, though the histogram is beginning to contract, hinting that downside momentum may be slowing. Daily RSI is currently in the 38–42 range, reflecting weak short-term momentum but not an extreme oversold condition. A recovery back above 50 RSI would be the first signal that buyers are regaining control.
From here, two paths are likely. Holding $70–72 could produce a mean-reversion bounce toward $90–105. A decisive break below $70, especially on rising volume, would increase the risk of a deeper retracement toward $55–60.
Oklo is under pressure but not structurally broken. The $70–75 zone is the key level that will determine whether this pullback remains corrective or develops into a broader trend shift.
Weekly momentum confirms the corrective phase. Weekly MACD has crossed lower and continues to expand to the downside, signaling sustained selling pressure. Weekly RSI has fallen from overbought levels above 70 and is now sitting near 45–48. This level suggests momentum has cooled but has not yet reached oversold conditions, leaving room for either further downside or sideways consolidation before a meaningful bounce.
The daily chart highlights more visible weakness. After topping near $190, Oklo transitioned into a clear sequence of lower highs and lower lows. Former support between $85–95 has failed and now acts as overhead resistance. Price is currently consolidating just above $75, a level that aligns with prior demand and the weekly channel support.
Daily MACD remains negative, though the histogram is beginning to contract, hinting that downside momentum may be slowing. Daily RSI is currently in the 38–42 range, reflecting weak short-term momentum but not an extreme oversold condition. A recovery back above 50 RSI would be the first signal that buyers are regaining control.
From here, two paths are likely. Holding $70–72 could produce a mean-reversion bounce toward $90–105. A decisive break below $70, especially on rising volume, would increase the risk of a deeper retracement toward $55–60.
Oklo is under pressure but not structurally broken. The $70–75 zone is the key level that will determine whether this pullback remains corrective or develops into a broader trend shift.

#1 in The Leap! (Christmas Edition 2025) | Market Analyst | Trader with over 20 years of hands-on trading experience across global markets. Join us: discord.gg/kZsPasg8 kgougakis@bullmarket.gr
إخلاء المسؤولية
لا يُقصد بالمعلومات والمنشورات أن تكون، أو تشكل، أي نصيحة مالية أو استثمارية أو تجارية أو أنواع أخرى من النصائح أو التوصيات المقدمة أو المعتمدة من TradingView. اقرأ المزيد في شروط الاستخدام.
#1 in The Leap! (Christmas Edition 2025) | Market Analyst | Trader with over 20 years of hands-on trading experience across global markets. Join us: discord.gg/kZsPasg8 kgougakis@bullmarket.gr
إخلاء المسؤولية
لا يُقصد بالمعلومات والمنشورات أن تكون، أو تشكل، أي نصيحة مالية أو استثمارية أو تجارية أو أنواع أخرى من النصائح أو التوصيات المقدمة أو المعتمدة من TradingView. اقرأ المزيد في شروط الاستخدام.