
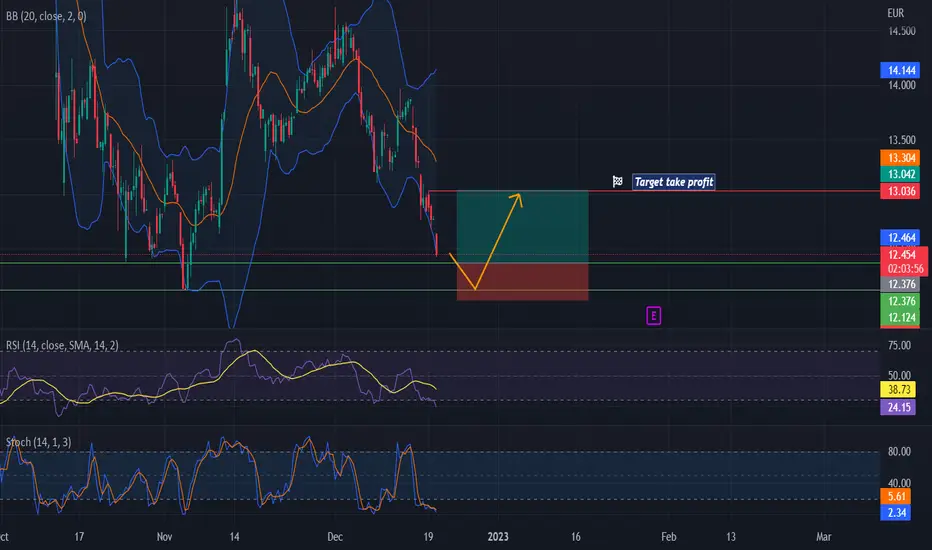
On the Philips chart (PHIA - 4h timeframe), We can see the price is currently oversold. The price is approaching a support area and is probably going to bounce off. Enter and leave the trade at the level defined on the chart.
The three indicators used are Bollinger Bands, RSI, and Stochastics. All these three indicators are confirming the oversold condition.
See all further details on the chart.
Good luck!
The three indicators used are Bollinger Bands, RSI, and Stochastics. All these three indicators are confirming the oversold condition.
See all further details on the chart.
Good luck!
أغلقت الصفقة: تم الوصول للهدف
target reached and overshooted.
💥 Free signals and ideas ➡ t.me/vfinvestment
منشورات ذات صلة
إخلاء المسؤولية
لا يُقصد بالمعلومات والمنشورات أن تكون، أو تشكل، أي نصيحة مالية أو استثمارية أو تجارية أو أنواع أخرى من النصائح أو التوصيات المقدمة أو المعتمدة من TradingView. اقرأ المزيد في شروط الاستخدام.
💥 Free signals and ideas ➡ t.me/vfinvestment
منشورات ذات صلة
إخلاء المسؤولية
لا يُقصد بالمعلومات والمنشورات أن تكون، أو تشكل، أي نصيحة مالية أو استثمارية أو تجارية أو أنواع أخرى من النصائح أو التوصيات المقدمة أو المعتمدة من TradingView. اقرأ المزيد في شروط الاستخدام.