
**PI/USDT – 30-Minute Chart Analysis**
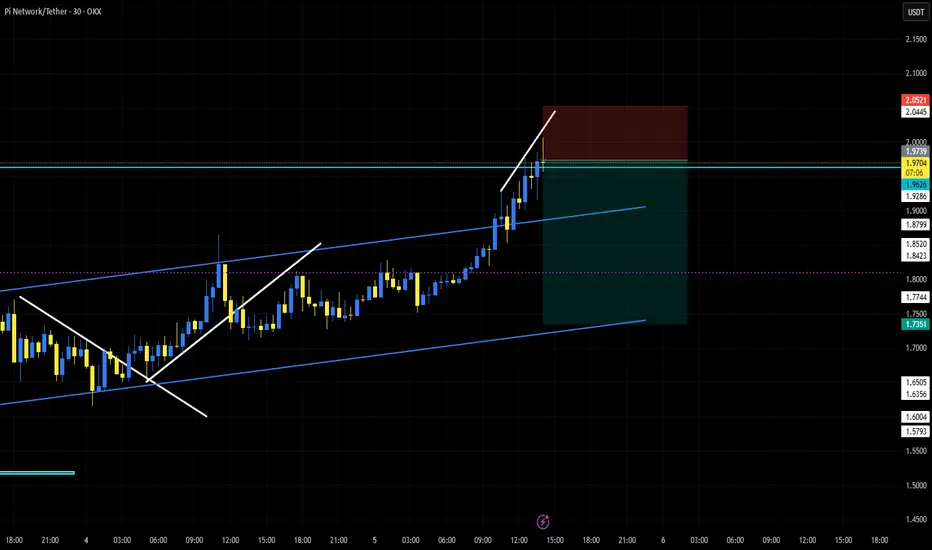
The price is moving within an ascending channel and has recently reached the **1.9730 - 2.0445** resistance zone. A rising wedge pattern has formed at the top of this trend, which could indicate weakening bullish momentum.
If the price reacts negatively to this level, a correction towards the **1.8500 - 1.8200** range is possible. Conversely, if the resistance is broken, the price could move towards **2.1000**.
The price is moving within an ascending channel and has recently reached the **1.9730 - 2.0445** resistance zone. A rising wedge pattern has formed at the top of this trend, which could indicate weakening bullish momentum.
If the price reacts negatively to this level, a correction towards the **1.8500 - 1.8200** range is possible. Conversely, if the resistance is broken, the price could move towards **2.1000**.
تم فتح الصفقة
Close at TP1
إخلاء المسؤولية
لا يُقصد بالمعلومات والمنشورات أن تكون، أو تشكل، أي نصيحة مالية أو استثمارية أو تجارية أو أنواع أخرى من النصائح أو التوصيات المقدمة أو المعتمدة من TradingView. اقرأ المزيد في شروط الاستخدام.
إخلاء المسؤولية
لا يُقصد بالمعلومات والمنشورات أن تكون، أو تشكل، أي نصيحة مالية أو استثمارية أو تجارية أو أنواع أخرى من النصائح أو التوصيات المقدمة أو المعتمدة من TradingView. اقرأ المزيد في شروط الاستخدام.