شراء
$QBTS - Falling Wedge Breakout: Fibonacci Confluence & Roadmap
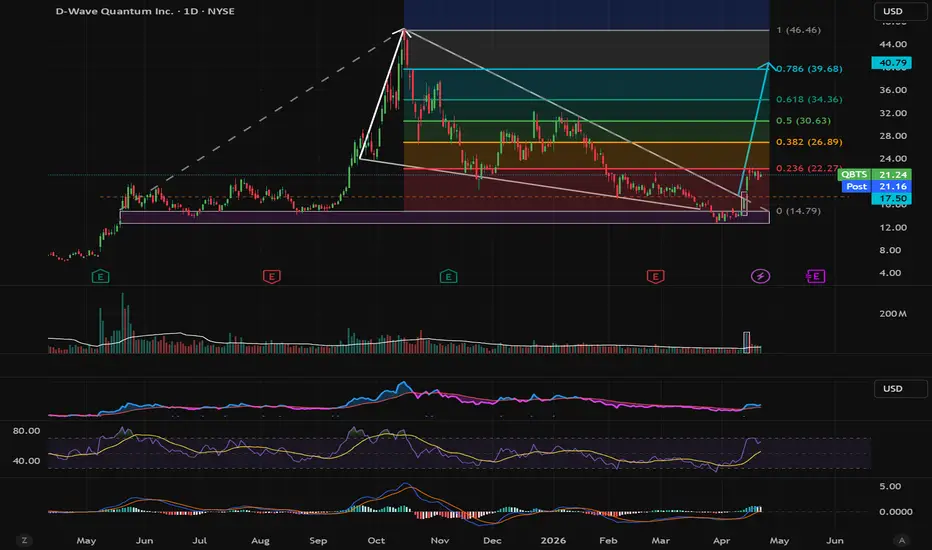
A falling wedge built over 8 months (August 2025 – April 2026), with strong historical support at the $13–15 zone tested multiple times. This month, QBTS broke out above $17.50 on the highest relative volume in months - confirming this as a genuine breakout, not a technical fakeout.
The confluence that makes this setup stand out:
The falling wedge measured move projects a target of $40.79. Fibonacci Retracement 0.786 (anchored from the October 25 high at $46.65 to the March 26 low at $14.79) gives $39.63. Two completely independent methods - less than $1.20 apart. That's not random. That's confluence.
Roadmap:
📌 $22.27 - Fib 0.236 (current price, holding above is crucial)
📌 $26.89 - Fib 0.382 (previous structural resistance, late 2025)
📌 $30.63 - Fib 0.5 (major psychological level)
📌 $34.35 - Fib 0.618
🎯 $39.63–$40.79 - Fib 0.786 + Measured Move confluence zone (final target)
Breakout zone: $17.50–$18.50 - now acting as support.
Invalidation: Daily close below $14.00
⚠️ Not financial advice.
The confluence that makes this setup stand out:
The falling wedge measured move projects a target of $40.79. Fibonacci Retracement 0.786 (anchored from the October 25 high at $46.65 to the March 26 low at $14.79) gives $39.63. Two completely independent methods - less than $1.20 apart. That's not random. That's confluence.
Roadmap:
📌 $22.27 - Fib 0.236 (current price, holding above is crucial)
📌 $26.89 - Fib 0.382 (previous structural resistance, late 2025)
📌 $30.63 - Fib 0.5 (major psychological level)
📌 $34.35 - Fib 0.618
🎯 $39.63–$40.79 - Fib 0.786 + Measured Move confluence zone (final target)
Breakout zone: $17.50–$18.50 - now acting as support.
Invalidation: Daily close below $14.00
⚠️ Not financial advice.
تم فتح الصفقة
QBTS: Technical Update & Growth TargetsQBTS received an additional tailwind today following a rating upgrade to "Hold" by Zacks Research, which supports the trend's stabilization above former support levels. The price has established itself above the $19 mark as the stock continues to gain strength, with the MACD indicating positive momentum.
A breakout of the critical resistance at $20.59 would target $25.22, $28.95, and $32.69 in ascending order. Looking at the long-term setup, the technical structure is aiming for the $38–$40 range. Meanwhile, the company is expected to report its quarterly earnings results on May 12.

إخلاء المسؤولية
لا يُقصد بالمعلومات والمنشورات أن تكون، أو تشكل، أي نصيحة مالية أو استثمارية أو تجارية أو أنواع أخرى من النصائح أو التوصيات المقدمة أو المعتمدة من TradingView. اقرأ المزيد في شروط الاستخدام.
إخلاء المسؤولية
لا يُقصد بالمعلومات والمنشورات أن تكون، أو تشكل، أي نصيحة مالية أو استثمارية أو تجارية أو أنواع أخرى من النصائح أو التوصيات المقدمة أو المعتمدة من TradingView. اقرأ المزيد في شروط الاستخدام.