
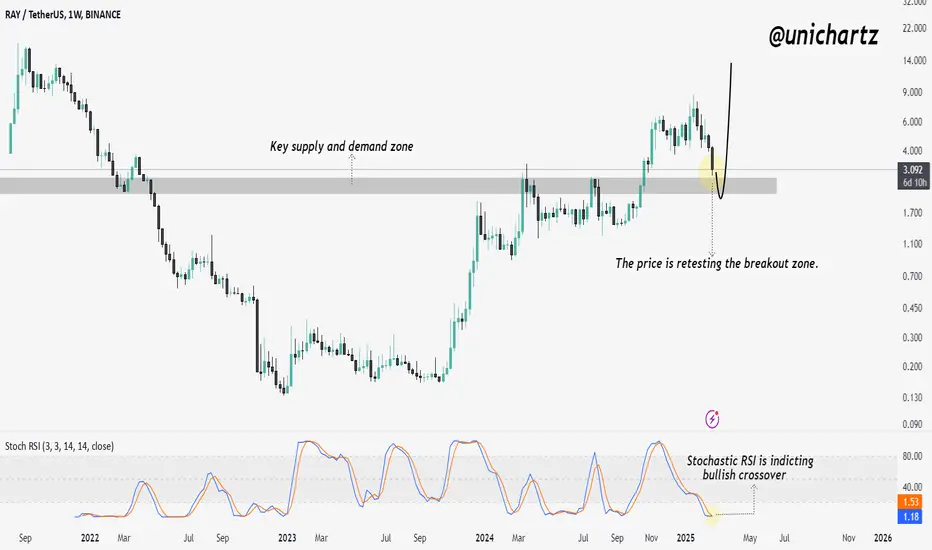
RRAY/USDT chart shows a key retest of the breakout zone, which previously acted as resistance and is now a crucial support level. A successful bounce could confirm bullish continuation, while a breakdown may lead to further downside.
Additionally, the Stochastic RSI is signaling a bullish crossover at oversold levels, indicating potential upward momentum. If buyers hold this zone, RAY could see a strong rally.
DYOR, NFA
Additionally, the Stochastic RSI is signaling a bullish crossover at oversold levels, indicating potential upward momentum. If buyers hold this zone, RAY could see a strong rally.
DYOR, NFA

Daily Free Signals :bit.ly/UnichartzAlpha
Register on Bitunix and trade with me: 👇
bitunix.com/register?vipCode=coEA
Register on Bitunix and trade with me: 👇
bitunix.com/register?vipCode=coEA
إخلاء المسؤولية
لا يُقصد بالمعلومات والمنشورات أن تكون، أو تشكل، أي نصيحة مالية أو استثمارية أو تجارية أو أنواع أخرى من النصائح أو التوصيات المقدمة أو المعتمدة من TradingView. اقرأ المزيد في شروط الاستخدام.
Daily Free Signals :bit.ly/UnichartzAlpha
Register on Bitunix and trade with me: 👇
bitunix.com/register?vipCode=coEA
Register on Bitunix and trade with me: 👇
bitunix.com/register?vipCode=coEA
إخلاء المسؤولية
لا يُقصد بالمعلومات والمنشورات أن تكون، أو تشكل، أي نصيحة مالية أو استثمارية أو تجارية أو أنواع أخرى من النصائح أو التوصيات المقدمة أو المعتمدة من TradingView. اقرأ المزيد في شروط الاستخدام.