
Hi traders,
Weekly Trading Strategy
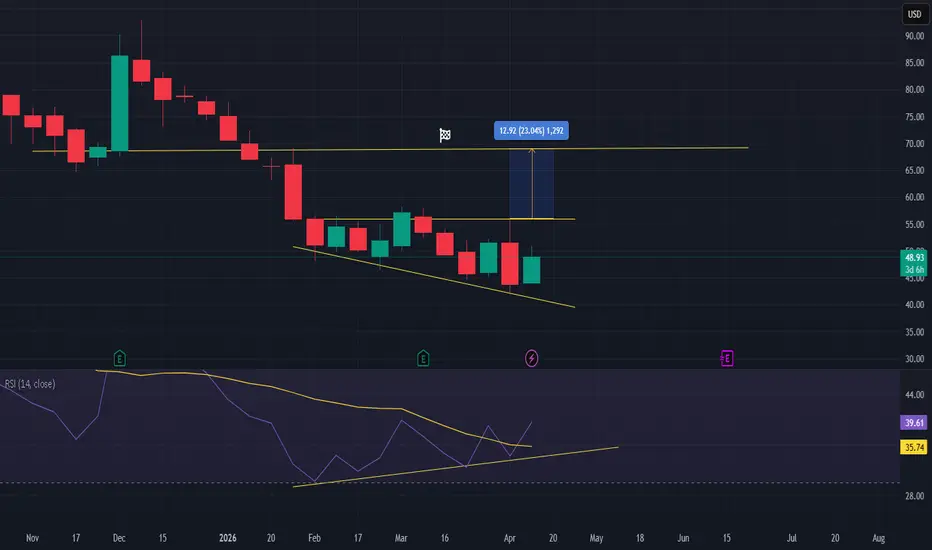
The stock is showing a potential double bottom or rounding bottom formation on the weekly chart after a period of decline.
Key Technical Observations:
• Support Level: Holding strong around the 27.50 - 28.00 zone.
• Resistance/Breakout Point: The immediate horizontal resistance is at 36.00. A weekly close above this level could signal a trend reversal.
• RSI: The RSI is currently around 48, moving upwards from oversold territory, suggesting gaining bullish momentum.
• Moving Averages: Price is currently testing the 20-week EMA.
Idea: Accumulate near support at 28.00 or wait for a confirmed weekly breakout above 36.00 for a long-term swing trade. Target the prior highs near 40.00+.
Weekly Trading Strategy
The stock is showing a potential double bottom or rounding bottom formation on the weekly chart after a period of decline.
Key Technical Observations:
• Support Level: Holding strong around the 27.50 - 28.00 zone.
• Resistance/Breakout Point: The immediate horizontal resistance is at 36.00. A weekly close above this level could signal a trend reversal.
• RSI: The RSI is currently around 48, moving upwards from oversold territory, suggesting gaining bullish momentum.
• Moving Averages: Price is currently testing the 20-week EMA.
Idea: Accumulate near support at 28.00 or wait for a confirmed weekly breakout above 36.00 for a long-term swing trade. Target the prior highs near 40.00+.
أغلقت الصفقة: تم الوصول للهدف
target reached
💥 Free signals and ideas ➡ t.me/vfinvestment
إخلاء المسؤولية
لا يُقصد بالمعلومات والمنشورات أن تكون، أو تشكل، أي نصيحة مالية أو استثمارية أو تجارية أو أنواع أخرى من النصائح أو التوصيات المقدمة أو المعتمدة من TradingView. اقرأ المزيد في شروط الاستخدام.
💥 Free signals and ideas ➡ t.me/vfinvestment
إخلاء المسؤولية
لا يُقصد بالمعلومات والمنشورات أن تكون، أو تشكل، أي نصيحة مالية أو استثمارية أو تجارية أو أنواع أخرى من النصائح أو التوصيات المقدمة أو المعتمدة من TradingView. اقرأ المزيد في شروط الاستخدام.