
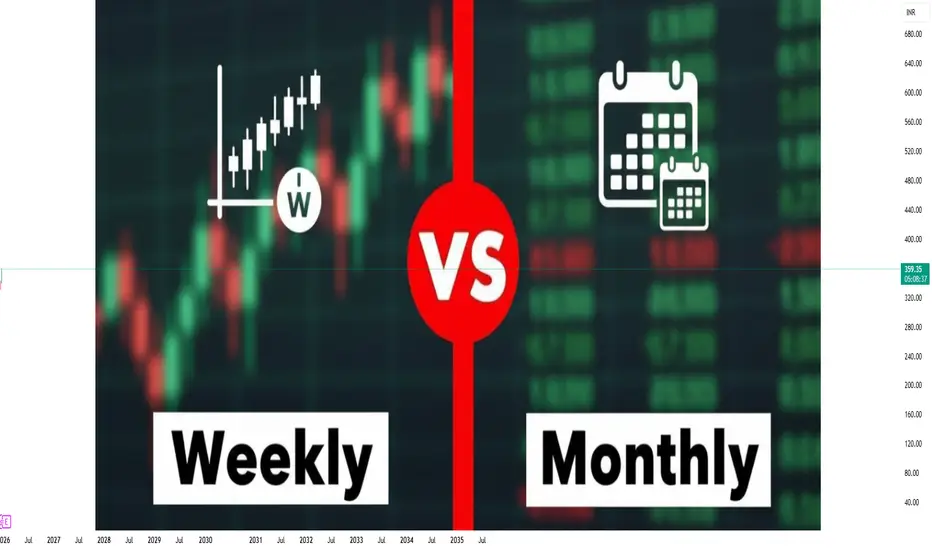
Framework for Consistent Market Analysis
In trading, timeframes define how a trader views the market, plans entries and exits, and manages risk. Among the most important higher timeframes are weekly and monthly charts, which are widely used by professional traders, investors, and institutions. While intraday and daily charts focus on short-term price fluctuations, weekly and monthly timeframes provide a broader market perspective, helping traders align their strategies with dominant trends, major support and resistance levels, and long-term market structure. Understanding how to use weekly and monthly timeframes effectively can significantly improve decision-making, reduce noise, and enhance consistency in trading performance.
Understanding the Weekly Timeframe in Trading
The weekly timeframe represents price movement over one full trading week, where each candlestick or bar reflects the open, high, low, and close of that week. This timeframe is particularly useful for swing traders and positional traders who aim to capture medium-term price movements lasting several weeks to a few months.
One of the primary advantages of the weekly timeframe is its ability to filter out daily volatility. Markets often experience sharp intraday or daily fluctuations driven by news, emotions, or short-term speculation. Weekly charts smooth these movements and highlight the true direction of the trend. When a stock consistently forms higher highs and higher lows on a weekly chart, it indicates strong bullish momentum, even if daily charts show temporary pullbacks.
Weekly charts are also highly effective for identifying key support and resistance levels. Levels formed on a weekly basis are generally stronger and more reliable than those on lower timeframes. A breakout above a weekly resistance or a breakdown below weekly support often signals a significant shift in market sentiment. Many institutional participants make decisions based on weekly levels, which is why price reactions around these zones tend to be powerful.
Another critical use of the weekly timeframe is trend confirmation. Traders often combine weekly charts with daily charts to ensure alignment. For example, if the weekly trend is bullish, traders may look for buying opportunities on daily pullbacks rather than taking counter-trend trades. This alignment improves probability and reduces the risk of trading against the dominant market force.
From a risk management perspective, weekly timeframes allow for wider stop-loss placements based on meaningful market structure rather than short-term noise. Although this may require smaller position sizes, it often results in more stable and disciplined trades with higher reward-to-risk potential.
Understanding the Monthly Timeframe in Trading
The monthly timeframe is the highest commonly used timeframe in technical analysis, where each candle represents one full month of price action. Monthly charts are primarily used by long-term investors, positional traders, and institutions to understand the overall market cycle and structural trend.
The biggest strength of the monthly timeframe lies in its ability to reveal the long-term trend and market phases. Whether a stock or index is in accumulation, markup, distribution, or decline becomes much clearer when viewed on a monthly chart. This helps traders avoid emotionally driven decisions and stay focused on the bigger picture.
Monthly charts are crucial for identifying major historical support and resistance zones. Levels formed over several months or years carry immense importance. When price approaches a long-standing monthly resistance, it often faces strong selling pressure. Conversely, monthly support zones tend to attract long-term buyers and institutions, making them ideal areas for strategic accumulation.
Another important application of the monthly timeframe is trend validation across market cycles. A bullish monthly structure indicates that the asset is suitable for long-term holding or buy-on-dips strategies. If the monthly trend turns bearish, traders may reduce exposure, shift to defensive strategies, or look for short-selling opportunities in relevant markets.
Monthly charts also help in understanding macro influences, such as interest rate cycles, economic growth phases, and sectoral rotations. Since these factors evolve over long periods, their impact is best observed on monthly timeframes rather than short-term charts.
Weekly vs Monthly Timeframes: Key Differences
While both weekly and monthly timeframes belong to higher timeframe analysis, they serve different purposes. The weekly timeframe is more action-oriented, helping traders fine-tune entries, exits, and trade management within the broader trend. The monthly timeframe, on the other hand, is more strategic, guiding long-term bias and portfolio positioning.
Weekly charts react faster to changes in trend compared to monthly charts, making them suitable for swing and positional trades. Monthly charts move slowly but offer stronger signals with higher reliability. A change in monthly trend is rare, but when it happens, it often marks a major shift in market dynamics.
Combining Weekly and Monthly Timeframes Effectively
Professional traders often use a top-down approach, starting with the monthly timeframe, then moving to the weekly, and finally to the daily or intraday charts. The monthly chart defines the long-term bias—bullish, bearish, or sideways. The weekly chart refines this bias by identifying actionable levels and trend strength.
For example, if the monthly trend is bullish and price is above key monthly support, traders may look for weekly pullbacks or consolidations as buying opportunities. If both monthly and weekly trends align, the probability of success increases significantly.
This multi-timeframe alignment also helps traders avoid overtrading. Instead of reacting to every minor price movement, traders focus only on setups that align with higher timeframe structure, leading to more disciplined and selective trading behavior.
Risk Management and Psychology in Higher Timeframes
Trading based on weekly and monthly timeframes naturally improves trading psychology. Since these timeframes reduce market noise, traders experience fewer emotional swings caused by small price fluctuations. Decisions become more logical, patient, and rule-based.
Risk management also becomes more structured. Stops and targets are based on well-defined levels rather than arbitrary price points. Although trades may take longer to play out, they often offer better reward-to-risk ratios and lower stress.
Conclusion
Weekly and monthly timeframes are essential tools for traders seeking consistency, clarity, and long-term success. The weekly timeframe provides a balanced view between responsiveness and reliability, making it ideal for swing and positional trading. The monthly timeframe offers a macro-level perspective, helping traders understand market cycles, structural trends, and long-term opportunities.
When used together, weekly and monthly analysis forms a powerful framework that aligns trading decisions with dominant market forces. By focusing on higher timeframes, traders can reduce noise, improve discipline, and make more informed decisions—key ingredients for sustainable profitability in the trading markets.
In trading, timeframes define how a trader views the market, plans entries and exits, and manages risk. Among the most important higher timeframes are weekly and monthly charts, which are widely used by professional traders, investors, and institutions. While intraday and daily charts focus on short-term price fluctuations, weekly and monthly timeframes provide a broader market perspective, helping traders align their strategies with dominant trends, major support and resistance levels, and long-term market structure. Understanding how to use weekly and monthly timeframes effectively can significantly improve decision-making, reduce noise, and enhance consistency in trading performance.
Understanding the Weekly Timeframe in Trading
The weekly timeframe represents price movement over one full trading week, where each candlestick or bar reflects the open, high, low, and close of that week. This timeframe is particularly useful for swing traders and positional traders who aim to capture medium-term price movements lasting several weeks to a few months.
One of the primary advantages of the weekly timeframe is its ability to filter out daily volatility. Markets often experience sharp intraday or daily fluctuations driven by news, emotions, or short-term speculation. Weekly charts smooth these movements and highlight the true direction of the trend. When a stock consistently forms higher highs and higher lows on a weekly chart, it indicates strong bullish momentum, even if daily charts show temporary pullbacks.
Weekly charts are also highly effective for identifying key support and resistance levels. Levels formed on a weekly basis are generally stronger and more reliable than those on lower timeframes. A breakout above a weekly resistance or a breakdown below weekly support often signals a significant shift in market sentiment. Many institutional participants make decisions based on weekly levels, which is why price reactions around these zones tend to be powerful.
Another critical use of the weekly timeframe is trend confirmation. Traders often combine weekly charts with daily charts to ensure alignment. For example, if the weekly trend is bullish, traders may look for buying opportunities on daily pullbacks rather than taking counter-trend trades. This alignment improves probability and reduces the risk of trading against the dominant market force.
From a risk management perspective, weekly timeframes allow for wider stop-loss placements based on meaningful market structure rather than short-term noise. Although this may require smaller position sizes, it often results in more stable and disciplined trades with higher reward-to-risk potential.
Understanding the Monthly Timeframe in Trading
The monthly timeframe is the highest commonly used timeframe in technical analysis, where each candle represents one full month of price action. Monthly charts are primarily used by long-term investors, positional traders, and institutions to understand the overall market cycle and structural trend.
The biggest strength of the monthly timeframe lies in its ability to reveal the long-term trend and market phases. Whether a stock or index is in accumulation, markup, distribution, or decline becomes much clearer when viewed on a monthly chart. This helps traders avoid emotionally driven decisions and stay focused on the bigger picture.
Monthly charts are crucial for identifying major historical support and resistance zones. Levels formed over several months or years carry immense importance. When price approaches a long-standing monthly resistance, it often faces strong selling pressure. Conversely, monthly support zones tend to attract long-term buyers and institutions, making them ideal areas for strategic accumulation.
Another important application of the monthly timeframe is trend validation across market cycles. A bullish monthly structure indicates that the asset is suitable for long-term holding or buy-on-dips strategies. If the monthly trend turns bearish, traders may reduce exposure, shift to defensive strategies, or look for short-selling opportunities in relevant markets.
Monthly charts also help in understanding macro influences, such as interest rate cycles, economic growth phases, and sectoral rotations. Since these factors evolve over long periods, their impact is best observed on monthly timeframes rather than short-term charts.
Weekly vs Monthly Timeframes: Key Differences
While both weekly and monthly timeframes belong to higher timeframe analysis, they serve different purposes. The weekly timeframe is more action-oriented, helping traders fine-tune entries, exits, and trade management within the broader trend. The monthly timeframe, on the other hand, is more strategic, guiding long-term bias and portfolio positioning.
Weekly charts react faster to changes in trend compared to monthly charts, making them suitable for swing and positional trades. Monthly charts move slowly but offer stronger signals with higher reliability. A change in monthly trend is rare, but when it happens, it often marks a major shift in market dynamics.
Combining Weekly and Monthly Timeframes Effectively
Professional traders often use a top-down approach, starting with the monthly timeframe, then moving to the weekly, and finally to the daily or intraday charts. The monthly chart defines the long-term bias—bullish, bearish, or sideways. The weekly chart refines this bias by identifying actionable levels and trend strength.
For example, if the monthly trend is bullish and price is above key monthly support, traders may look for weekly pullbacks or consolidations as buying opportunities. If both monthly and weekly trends align, the probability of success increases significantly.
This multi-timeframe alignment also helps traders avoid overtrading. Instead of reacting to every minor price movement, traders focus only on setups that align with higher timeframe structure, leading to more disciplined and selective trading behavior.
Risk Management and Psychology in Higher Timeframes
Trading based on weekly and monthly timeframes naturally improves trading psychology. Since these timeframes reduce market noise, traders experience fewer emotional swings caused by small price fluctuations. Decisions become more logical, patient, and rule-based.
Risk management also becomes more structured. Stops and targets are based on well-defined levels rather than arbitrary price points. Although trades may take longer to play out, they often offer better reward-to-risk ratios and lower stress.
Conclusion
Weekly and monthly timeframes are essential tools for traders seeking consistency, clarity, and long-term success. The weekly timeframe provides a balanced view between responsiveness and reliability, making it ideal for swing and positional trading. The monthly timeframe offers a macro-level perspective, helping traders understand market cycles, structural trends, and long-term opportunities.
When used together, weekly and monthly analysis forms a powerful framework that aligns trading decisions with dominant market forces. By focusing on higher timeframes, traders can reduce noise, improve discipline, and make more informed decisions—key ingredients for sustainable profitability in the trading markets.

منشورات ذات صلة
إخلاء المسؤولية
لا يُقصد بالمعلومات والمنشورات أن تكون، أو تشكل، أي نصيحة مالية أو استثمارية أو تجارية أو أنواع أخرى من النصائح أو التوصيات المقدمة أو المعتمدة من TradingView. اقرأ المزيد في شروط الاستخدام.
منشورات ذات صلة
إخلاء المسؤولية
لا يُقصد بالمعلومات والمنشورات أن تكون، أو تشكل، أي نصيحة مالية أو استثمارية أو تجارية أو أنواع أخرى من النصائح أو التوصيات المقدمة أو المعتمدة من TradingView. اقرأ المزيد في شروط الاستخدام.