
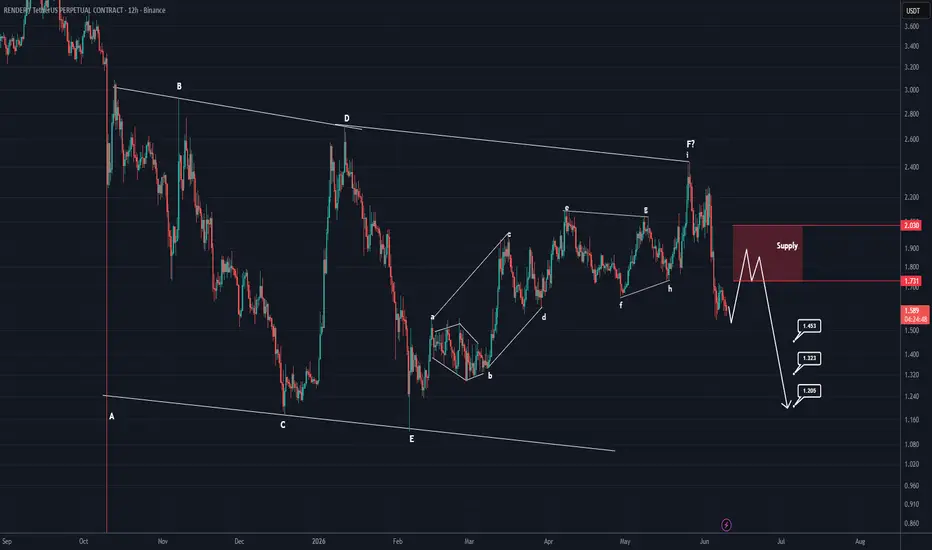
The larger structure that RENDER appears to have formed looks like a Diametric pattern.
Wave F of this Diametric has itself unfolded as a Symmetrical pattern and now seems to be complete. The price is currently developing Wave G of the overall formation.
A pullback into the red zone is expected before RENDER continues its decline.
We are looking for sell/short positions within the highlighted red zone.
The targets are marked on the chart. Once Target 1 is reached, move your stop loss to break-even.
If you have a symbol you want analyzed, first hit the like button and then comment its name so I can review it for you.
Do you also think RENDER is bearish?
تم فتح الصفقة
It pumped more than 21% according to our previous analysis and reached the entry zone. It can now be rejected.A stronger confirmation for a decline will be issued when CH occurs. We have marked this on the chart.
أغلقت الصفقة: تم الوصول للهدف
In the end, it dropped by more than 15% , and the first target was hit.
🔥 Don't Just Watch the Market. Understand It!
📊 Crypto Analysis & Setups:
👉 t.me/Behdark_EN
💹 Forex Analysis & Setups:
👉 t.me/FX_Behdark
🚀 Join BehDark for Market Insights, Trading Setups & Key Levels. Choose Your Market & Join Us!
📊 Crypto Analysis & Setups:
👉 t.me/Behdark_EN
💹 Forex Analysis & Setups:
👉 t.me/FX_Behdark
🚀 Join BehDark for Market Insights, Trading Setups & Key Levels. Choose Your Market & Join Us!
إخلاء المسؤولية
لا يُقصد بالمعلومات والمنشورات أن تكون، أو تشكل، أي نصيحة مالية أو استثمارية أو تجارية أو أنواع أخرى من النصائح أو التوصيات المقدمة أو المعتمدة من TradingView. اقرأ المزيد في شروط الاستخدام.