
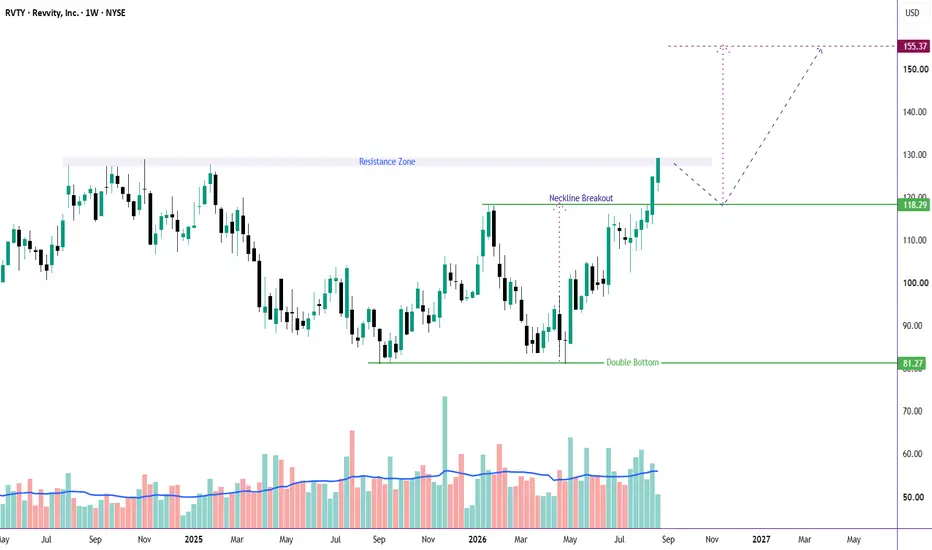
🚀 RVTY — Double Bottom Is Playing Out
I picked RVTY earlier from a double-bottom setup around (see attached post)
Now the story is getting interesting…
🔹 $118.2 neckline → BROKEN ✅
🔹 Price has pushed straight into the $128–130 resistance zone 🧱
🔹 The breakout gives the pattern a measured target around $155 🎯
So what happens next? 👀
🐂 Bull Case:
If RVTY holds above the $118 neckline, the breakout remains intact. A shallow pullback/retest of $118–120 followed by renewed buying could be the ideal continuation setup. 🚀
🔥 Momentum Case:
If buyers absorb the $128–130 resistance without a meaningful pullback, price could continue higher and start working toward the $155 measured target.
⚠️ Bear Case:
If price gets rejected hard from resistance and loses the $118 breakout level, the breakout could prove false — making the neckline the key level to watch.
📌 My roadmap:
Double Bottom → Neckline Breakout → Resistance Test → Retest or Continuation → $155 Target
The key question now isn't “did it break out?” — it did.
It's whether $118.2 becomes support. 👑
Not financial advice. Just the chart setup I'm watching. 📊
I picked RVTY earlier from a double-bottom setup around (see attached post)
Now the story is getting interesting…
🔹 $118.2 neckline → BROKEN ✅
🔹 Price has pushed straight into the $128–130 resistance zone 🧱
🔹 The breakout gives the pattern a measured target around $155 🎯
So what happens next? 👀
🐂 Bull Case:
If RVTY holds above the $118 neckline, the breakout remains intact. A shallow pullback/retest of $118–120 followed by renewed buying could be the ideal continuation setup. 🚀
🔥 Momentum Case:
If buyers absorb the $128–130 resistance without a meaningful pullback, price could continue higher and start working toward the $155 measured target.
⚠️ Bear Case:
If price gets rejected hard from resistance and loses the $118 breakout level, the breakout could prove false — making the neckline the key level to watch.
📌 My roadmap:
Double Bottom → Neckline Breakout → Resistance Test → Retest or Continuation → $155 Target
The key question now isn't “did it break out?” — it did.
It's whether $118.2 becomes support. 👑
Not financial advice. Just the chart setup I'm watching. 📊
ملاحظة
Weekly closing at 130 is very positive,.ملاحظة
there is retest and rebount. ملاحظة
Broke Strong resistance, on track to this the target.
📊 Charts → 🏗️ Structure → 🎯 Probability =📖 Chart Story
⏳ Patience → 🚀Success
🎯 If this setup makes sense to you, show it some support with a Boost.
⏳ Patience → 🚀Success
🎯 If this setup makes sense to you, show it some support with a Boost.
منشورات ذات صلة
إخلاء المسؤولية
لا يُقصد بالمعلومات والمنشورات أن تكون، أو تشكل، أي نصيحة مالية أو استثمارية أو تجارية أو أنواع أخرى من النصائح أو التوصيات المقدمة أو المعتمدة من TradingView. اقرأ المزيد في شروط الاستخدام.
📊 Charts → 🏗️ Structure → 🎯 Probability =📖 Chart Story
⏳ Patience → 🚀Success
🎯 If this setup makes sense to you, show it some support with a Boost.
⏳ Patience → 🚀Success
🎯 If this setup makes sense to you, show it some support with a Boost.
منشورات ذات صلة
إخلاء المسؤولية
لا يُقصد بالمعلومات والمنشورات أن تكون، أو تشكل، أي نصيحة مالية أو استثمارية أو تجارية أو أنواع أخرى من النصائح أو التوصيات المقدمة أو المعتمدة من TradingView. اقرأ المزيد في شروط الاستخدام.