
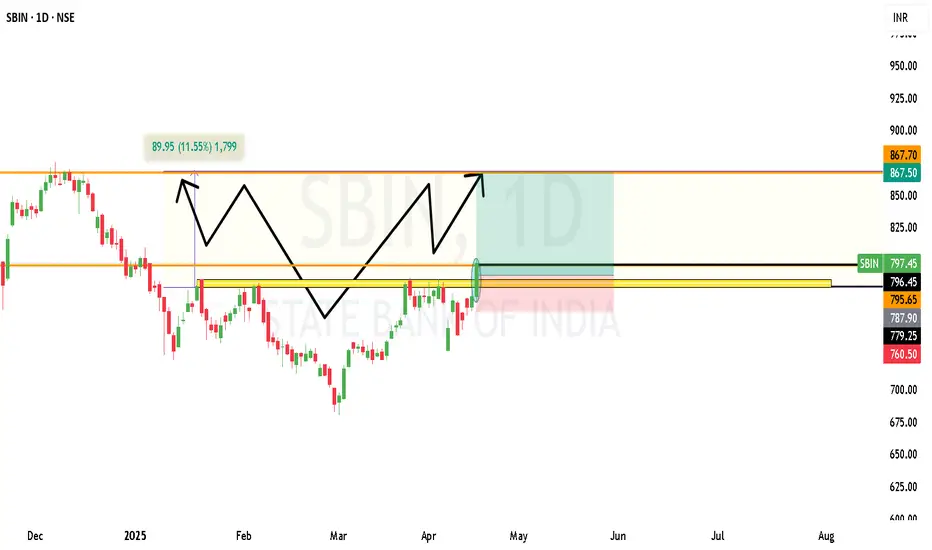
Exciting pattern on SBIN(State Bank Of India) chart!
Validation of my target:
1. Inverted Head & Shoulder pattern confirmed on daily chart.
2. Neckline breakout already happened @ 822
3. Target Calculation: Neckline + (Neckline - head low)
Approx. 874,
4. Technical Indicator also supportive
*RSI trending up from oversold zone
* MACD crossover happened recently.
Target will range between 10 points 864 to 874.
Risk to reward is 1:3
Stop Loss previous low 760
For Educational purpose only

إخلاء المسؤولية
لا يُقصد بالمعلومات والمنشورات أن تكون، أو تشكل، أي نصيحة مالية أو استثمارية أو تجارية أو أنواع أخرى من النصائح أو التوصيات المقدمة أو المعتمدة من TradingView. اقرأ المزيد في شروط الاستخدام.
إخلاء المسؤولية
لا يُقصد بالمعلومات والمنشورات أن تكون، أو تشكل، أي نصيحة مالية أو استثمارية أو تجارية أو أنواع أخرى من النصائح أو التوصيات المقدمة أو المعتمدة من TradingView. اقرأ المزيد في شروط الاستخدام.