
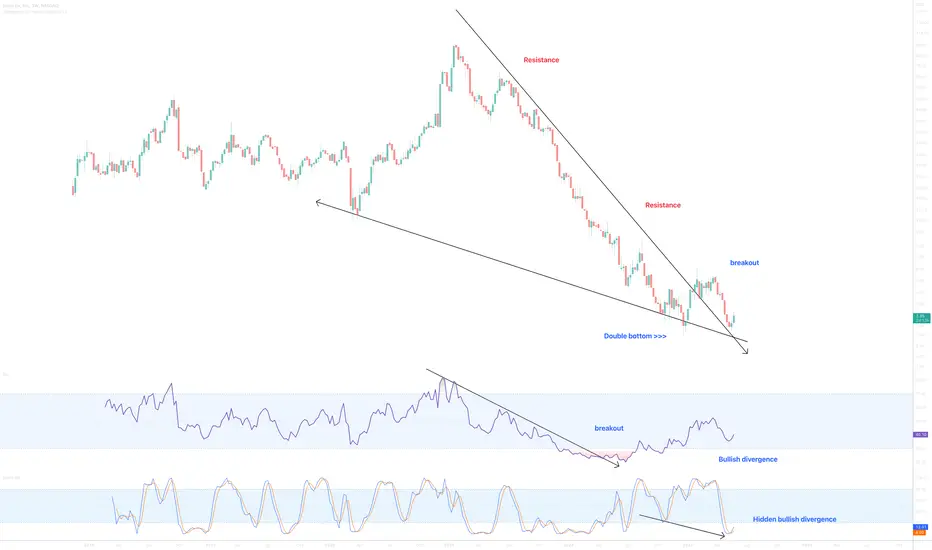
On the above weekly chart price action has corrected 97% since the sell signal printed in February 2021. A number of reasons now exist to have a long position, including:
1) You know why..
2) Price action and RSI resistance breakouts.
3) Price action prints a double with higher lows in RSI.
4) Stochastic RSI prints hidden bullish divergence, fantastic.
5) No stock splits.
Is it possible price action falls further? Sure.
Is it probable? No.
Ww
Type: investment
Risk: <=6% of portfolio
Timeframe: Don’t know.
Return: Will say somewhere else
Stop loss: <= 2.40
تم فتح الصفقة
Support on past resistance now confirmed.ملاحظة
GRM support confirmedملاحظة
breakout! Hold it until 100+ dollarsتم فتح الصفقة
ملاحظة
resistance breakout ملاحظة
Past resistance confirms support.
إخلاء المسؤولية
لا يُقصد بالمعلومات والمنشورات أن تكون، أو تشكل، أي نصيحة مالية أو استثمارية أو تجارية أو أنواع أخرى من النصائح أو التوصيات المقدمة أو المعتمدة من TradingView. اقرأ المزيد في شروط الاستخدام.
إخلاء المسؤولية
لا يُقصد بالمعلومات والمنشورات أن تكون، أو تشكل، أي نصيحة مالية أو استثمارية أو تجارية أو أنواع أخرى من النصائح أو التوصيات المقدمة أو المعتمدة من TradingView. اقرأ المزيد في شروط الاستخدام.