 SMH
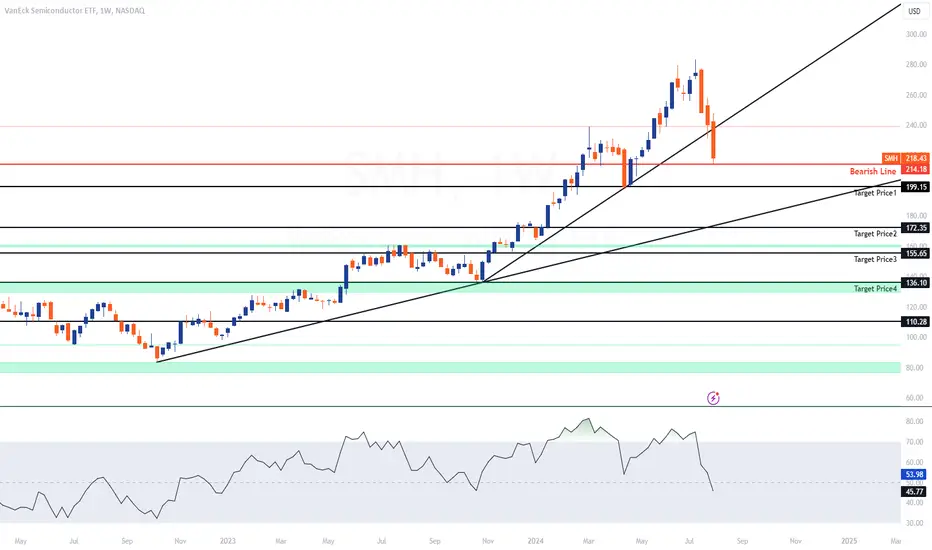
VanEck Semiconductor ETF (SMH) Weekly Analysis:
Current Price Action:
SMH is trading at $218.43, down 9.10% for the week.
Price has breached the upward trendline support, indicating potential further downside.
Key Levels:
Bearish Line: $214.18
Target Price 1: $199.15
Target Price 2: $172.35
Target Price 3: $155.65
Target Price 4: $136.10
Support Zones:
Immediate support is expected around $199.15.
Further support levels are $172.35, $155.65, and $136.10.
Resistance Levels:
Resistance is at the broken trendline near $240, followed by the recent high around $300.
Relative Strength Index (RSI):
RSI is at 53.98, trending downwards, suggesting weakening momentum.
Volume:
Volume is significant at 75.462M, indicating strong selling pressure.
Conclusion:
SMH's breakdown below key support levels and significant bearish momentum suggest further downside potential. Watch for reactions around $199.15 and $172.35 for potential entry points or further declines.
أغلقت الصفقة: تم الوصول للهدف
Target Price 1: $199.15ملاحظة
TP2 HIT
منشورات ذات صلة
إخلاء المسؤولية
لا يُقصد بالمعلومات والمنشورات أن تكون، أو تشكل، أي نصيحة مالية أو استثمارية أو تجارية أو أنواع أخرى من النصائح أو التوصيات المقدمة أو المعتمدة من TradingView. اقرأ المزيد في شروط الاستخدام.
منشورات ذات صلة
إخلاء المسؤولية
لا يُقصد بالمعلومات والمنشورات أن تكون، أو تشكل، أي نصيحة مالية أو استثمارية أو تجارية أو أنواع أخرى من النصائح أو التوصيات المقدمة أو المعتمدة من TradingView. اقرأ المزيد في شروط الاستخدام.