
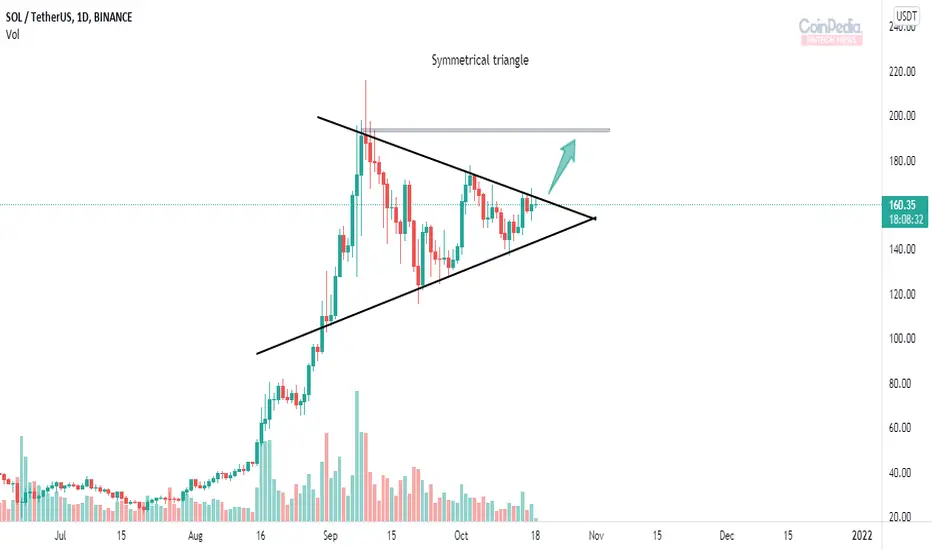
* Solana in 1D time frame forms a Symmetrical triangle
* Symmetrical triangle appears when the price consolidates between two trend-lines slightly sloping towards each other.
* Here the below Ascending trendline works as support for the price and the above Descending trendline as resistance
* If SOL breaks the above trendline we can see continuation of the trend.
* Symmetrical triangle appears when the price consolidates between two trend-lines slightly sloping towards each other.
* Here the below Ascending trendline works as support for the price and the above Descending trendline as resistance
* If SOL breaks the above trendline we can see continuation of the trend.
أغلقت الصفقة: تم الوصول للهدف

إخلاء المسؤولية
لا يُقصد بالمعلومات والمنشورات أن تكون، أو تشكل، أي نصيحة مالية أو استثمارية أو تجارية أو أنواع أخرى من النصائح أو التوصيات المقدمة أو المعتمدة من TradingView. اقرأ المزيد في شروط الاستخدام.
إخلاء المسؤولية
لا يُقصد بالمعلومات والمنشورات أن تكون، أو تشكل، أي نصيحة مالية أو استثمارية أو تجارية أو أنواع أخرى من النصائح أو التوصيات المقدمة أو المعتمدة من TradingView. اقرأ المزيد في شروط الاستخدام.