
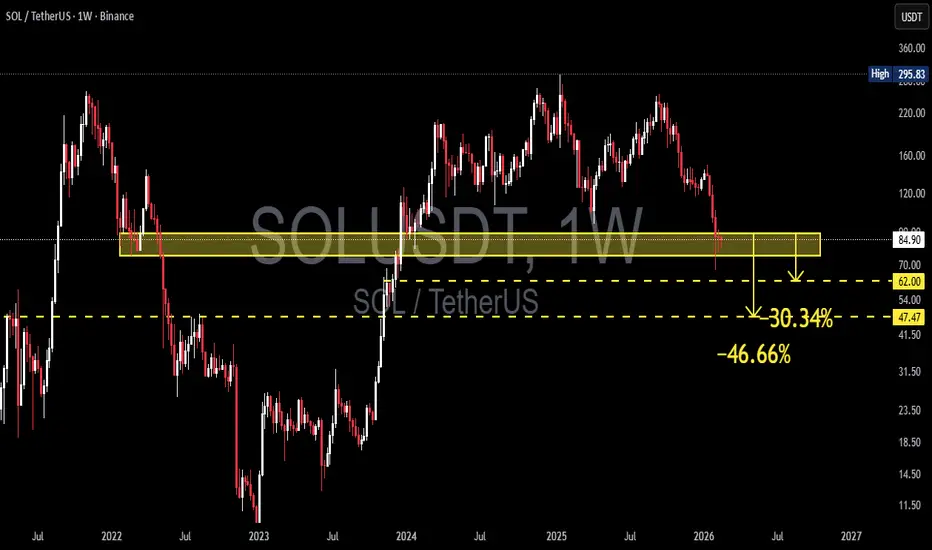
On the 1W (Weekly) timeframe, SOLUSDT is currently testing a key zone that previously acted as strong support and has now turned into a critical resistance area at 89 – 75 USDT (yellow block).
This zone represents:
A strong demand area in 2022
A major accumulation base before the 2024 rally
A horizontal support that has flipped into resistance (S/R Flip)
Price is currently trading just below this area after a sharp decline from the 2025 swing high.
---
Structure & Pattern Formation
From a market structure perspective:
A Lower High has formed after failing to sustain above the 160–200 region
Breakdown from mid-range structure
Retest of weekly supply (89–75 zone)
This suggests:
Distribution / Bearish Rejection Zone
The 89–75 area acts as:
A historical distribution base
A multi-year supply zone
Strong horizontal resistance
If price fails to reclaim this zone, this move could be interpreted as a breakdown retest before the next bearish leg.
---
Key Levels
Resistance:
89 – 75 (Critical Weekly Supply Zone)
100 – 110 (Next resistance if breakout occurs)
Support:
62 USDT (≈ -30% downside projection)
47 USDT (≈ -46% downside projection)
40–50 zone (Historical 2023 demand area)
Downside projections shown on the chart:
From 89 → 62 = -30.34%
From 89 → 47 = -46.66%
---
Bullish Scenario
Bullish confirmation requires:
1. A strong weekly close above 89
2. Reclaiming the 89–75 zone as support
3. Formation of a Higher Low above 75
If confirmed, upside targets:
110
140
160
Potential revisit of 200+ in the next expansion cycle
A valid bullish continuation would require strong weekly momentum and significant volume.
---
Bearish Scenario (Currently More Dominant)
If price fails to break and close above 89 and shows rejection:
Downside targets:
1. 62 USDT (-30%)
2. 47 USDT (-46%)
3. Possible liquidity sweep into the 40 zone if broader market weakens
This would confirm the 89–75 zone as a strong multi-year resistance.
As long as price remains below 89, the structure leans bearish.
---
Conclusion
The 89 – 75 zone is the major decision point for SOL.
As long as price trades below this zone, the risk of a correction toward 62 and even 47 remains open.
A breakout and reclaim above this area would shift the bias back to bullish.
Weekly close confirmation is key.
The market is currently at a high-impact decision level.
#SOLUSDT #SOLAnalysis #CryptoAnalysis #TechnicalAnalysis #PriceAction #Altcoin #CryptoTrading #WeeklyChart #SupportResistance #CryptoMarket
This zone represents:
A strong demand area in 2022
A major accumulation base before the 2024 rally
A horizontal support that has flipped into resistance (S/R Flip)
Price is currently trading just below this area after a sharp decline from the 2025 swing high.
---
Structure & Pattern Formation
From a market structure perspective:
A Lower High has formed after failing to sustain above the 160–200 region
Breakdown from mid-range structure
Retest of weekly supply (89–75 zone)
This suggests:
Distribution / Bearish Rejection Zone
The 89–75 area acts as:
A historical distribution base
A multi-year supply zone
Strong horizontal resistance
If price fails to reclaim this zone, this move could be interpreted as a breakdown retest before the next bearish leg.
---
Key Levels
Resistance:
89 – 75 (Critical Weekly Supply Zone)
100 – 110 (Next resistance if breakout occurs)
Support:
62 USDT (≈ -30% downside projection)
47 USDT (≈ -46% downside projection)
40–50 zone (Historical 2023 demand area)
Downside projections shown on the chart:
From 89 → 62 = -30.34%
From 89 → 47 = -46.66%
---
Bullish Scenario
Bullish confirmation requires:
1. A strong weekly close above 89
2. Reclaiming the 89–75 zone as support
3. Formation of a Higher Low above 75
If confirmed, upside targets:
110
140
160
Potential revisit of 200+ in the next expansion cycle
A valid bullish continuation would require strong weekly momentum and significant volume.
---
Bearish Scenario (Currently More Dominant)
If price fails to break and close above 89 and shows rejection:
Downside targets:
1. 62 USDT (-30%)
2. 47 USDT (-46%)
3. Possible liquidity sweep into the 40 zone if broader market weakens
This would confirm the 89–75 zone as a strong multi-year resistance.
As long as price remains below 89, the structure leans bearish.
---
Conclusion
The 89 – 75 zone is the major decision point for SOL.
As long as price trades below this zone, the risk of a correction toward 62 and even 47 remains open.
A breakout and reclaim above this area would shift the bias back to bullish.
Weekly close confirmation is key.
The market is currently at a high-impact decision level.
#SOLUSDT #SOLAnalysis #CryptoAnalysis #TechnicalAnalysis #PriceAction #Altcoin #CryptoTrading #WeeklyChart #SupportResistance #CryptoMarket

✅ Get Free Signals! Join Our Telegram Channel Here: t.me/TheCryptoNuclear
✅ Twitter: twitter.com/crypto_nuclear
✅ Join Bybit : partner.bybit.com/b/nuclearvip
✅ Benefits : Lifetime Trading Fee Discount -50%
✅ Twitter: twitter.com/crypto_nuclear
✅ Join Bybit : partner.bybit.com/b/nuclearvip
✅ Benefits : Lifetime Trading Fee Discount -50%
إخلاء المسؤولية
لا يُقصد بالمعلومات والمنشورات أن تكون، أو تشكل، أي نصيحة مالية أو استثمارية أو تجارية أو أنواع أخرى من النصائح أو التوصيات المقدمة أو المعتمدة من TradingView. اقرأ المزيد في شروط الاستخدام.
✅ Get Free Signals! Join Our Telegram Channel Here: t.me/TheCryptoNuclear
✅ Twitter: twitter.com/crypto_nuclear
✅ Join Bybit : partner.bybit.com/b/nuclearvip
✅ Benefits : Lifetime Trading Fee Discount -50%
✅ Twitter: twitter.com/crypto_nuclear
✅ Join Bybit : partner.bybit.com/b/nuclearvip
✅ Benefits : Lifetime Trading Fee Discount -50%
إخلاء المسؤولية
لا يُقصد بالمعلومات والمنشورات أن تكون، أو تشكل، أي نصيحة مالية أو استثمارية أو تجارية أو أنواع أخرى من النصائح أو التوصيات المقدمة أو المعتمدة من TradingView. اقرأ المزيد في شروط الاستخدام.