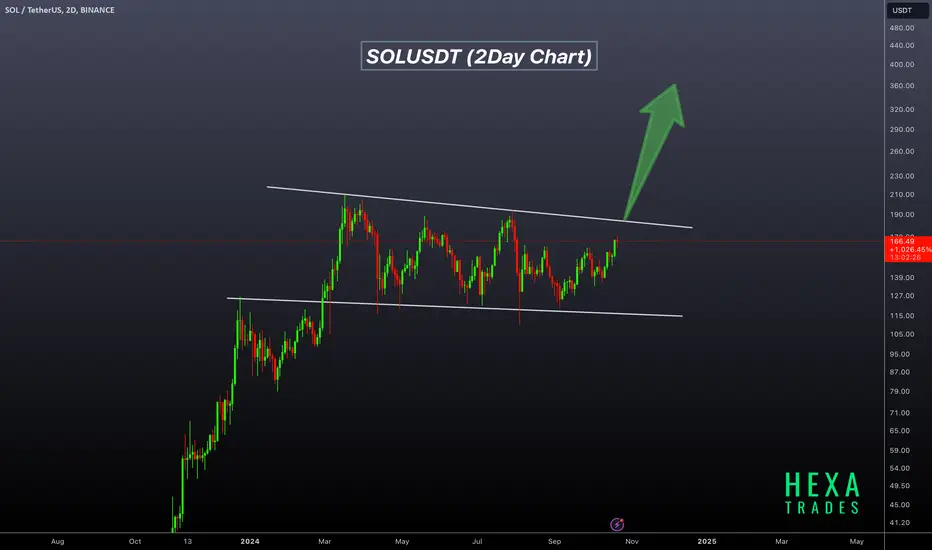
SOLUSDT Technical analysis update
SOLUSDT has been forming a bullish flag pattern over the last 230 days. The price is now moving toward the flag resistance line for a potential breakout. Once the breakout occurs, we can expect a price move of 50% to 150%. Additionally, the price is trading above the 100 and 200 EMA on the daily chart.
Buy level: After confirmation of the breakout from the flag pattern.
SOLUSDT has been forming a bullish flag pattern over the last 230 days. The price is now moving toward the flag resistance line for a potential breakout. Once the breakout occurs, we can expect a price move of 50% to 150%. Additionally, the price is trading above the 100 and 200 EMA on the daily chart.
Buy level: After confirmation of the breakout from the flag pattern.
تم فتح الصفقة
SOLUSDT price is about to break flag resistance.Buy after the price breaks the resistance line.
تم فتح الصفقة

 SOLUSDT bullish flag pattern breakout confirmed!

🚀Telegram : t.me/hexatrades
🌐Website: hexatrades.io/
🗣️Twitter(X): twitter.com/HexaTrades
🌐Website: hexatrades.io/
🗣️Twitter(X): twitter.com/HexaTrades
منشورات ذات صلة
إخلاء المسؤولية
لا يُقصد بالمعلومات والمنشورات أن تكون، أو تشكل، أي نصيحة مالية أو استثمارية أو تجارية أو أنواع أخرى من النصائح أو التوصيات المقدمة أو المعتمدة من TradingView. اقرأ المزيد في شروط الاستخدام.
🚀Telegram : t.me/hexatrades
🌐Website: hexatrades.io/
🗣️Twitter(X): twitter.com/HexaTrades
🌐Website: hexatrades.io/
🗣️Twitter(X): twitter.com/HexaTrades
منشورات ذات صلة
إخلاء المسؤولية
لا يُقصد بالمعلومات والمنشورات أن تكون، أو تشكل، أي نصيحة مالية أو استثمارية أو تجارية أو أنواع أخرى من النصائح أو التوصيات المقدمة أو المعتمدة من TradingView. اقرأ المزيد في شروط الاستخدام.