
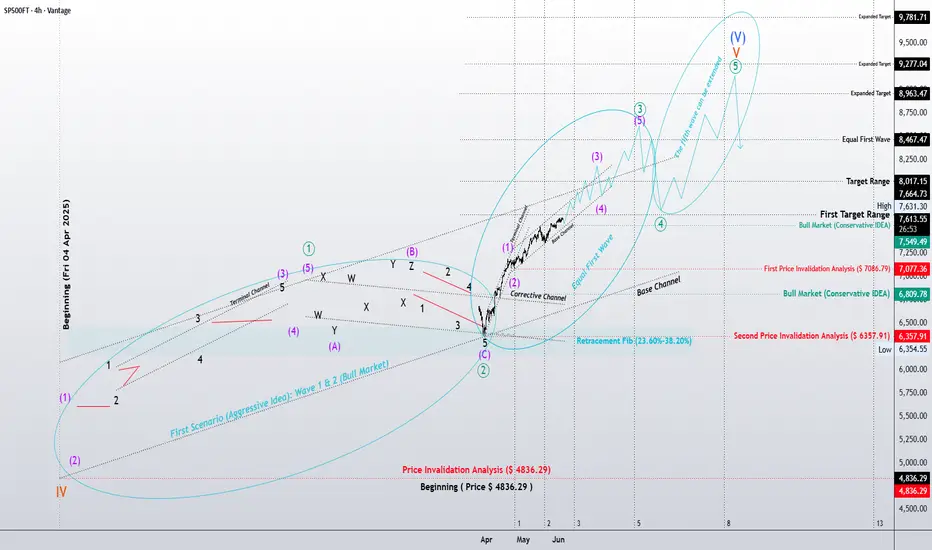
This analysis examines the S&P 500 through a multi-scale and multi-timeframe Elliott Wave framework, focusing on the duality between Arithmetic and Logarithmic perspectives.
The Multi-Timeframe Strategy:
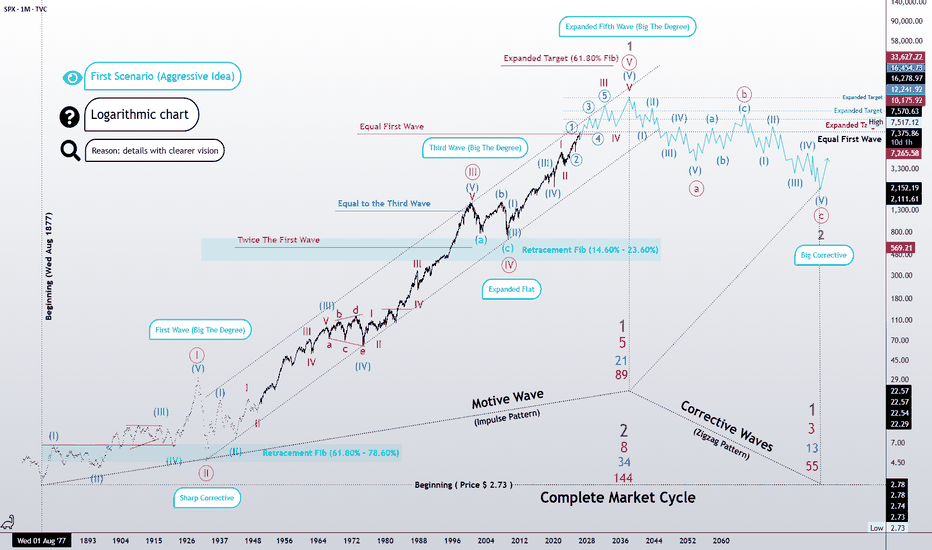
The Macro Logarithmic Chart: Defines the historical cycle and the proportional maturity of the broader impulse. It suggests whether the “Market’s Breath” is fully exhausted.
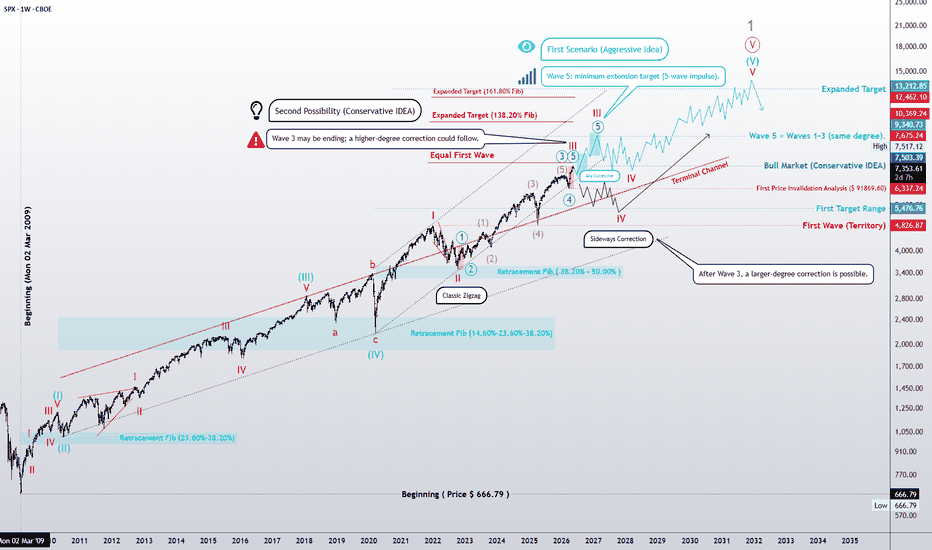
The Monthly Chart: Identifies the current position within the higher-degree wave structure and the transition from equality into potential extension.
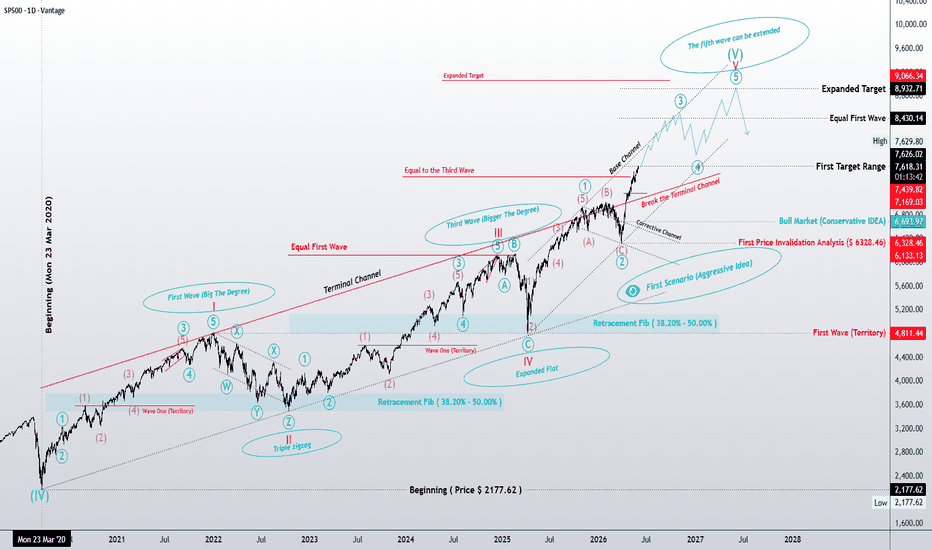
The Weekly Chart: Narrows the focus to the execution zone, where confirmation, invalidation, and immediate wave-count targets become critical.
The Structural Thesis:
On the Arithmetic Scale, Wave 3 has reached absolute equality with Wave 1. While this often signals a completion point, the Logarithmic Scale reveals that the broader cycle hasn’t reached full proportional maturity yet. This discrepancy keeps the probability of a Wave 5 Extension on the table.
Intermarket Catalyst:
Watch the DXY (U.S. Dollar Index). An impulsive bullish move in the Dollar could transform the current equity consolidation into a larger-degree structural reset.
Summary:
The macro chart shows where the market is in history.
The monthly chart shows where the market is within the cycle.
The weekly chart shows where the market is now.
The Multi-Timeframe Strategy:
The Macro Logarithmic Chart: Defines the historical cycle and the proportional maturity of the broader impulse. It suggests whether the “Market’s Breath” is fully exhausted.
The Monthly Chart: Identifies the current position within the higher-degree wave structure and the transition from equality into potential extension.
The Weekly Chart: Narrows the focus to the execution zone, where confirmation, invalidation, and immediate wave-count targets become critical.
The Structural Thesis:
On the Arithmetic Scale, Wave 3 has reached absolute equality with Wave 1. While this often signals a completion point, the Logarithmic Scale reveals that the broader cycle hasn’t reached full proportional maturity yet. This discrepancy keeps the probability of a Wave 5 Extension on the table.
Intermarket Catalyst:
Watch the DXY (U.S. Dollar Index). An impulsive bullish move in the Dollar could transform the current equity consolidation into a larger-degree structural reset.
Summary:
The macro chart shows where the market is in history.
The monthly chart shows where the market is within the cycle.
The weekly chart shows where the market is now.

منشورات ذات صلة
إخلاء المسؤولية
لا يُقصد بالمعلومات والمنشورات أن تكون، أو تشكل، أي نصيحة مالية أو استثمارية أو تجارية أو أنواع أخرى من النصائح أو التوصيات المقدمة أو المعتمدة من TradingView. اقرأ المزيد في شروط الاستخدام.
منشورات ذات صلة
إخلاء المسؤولية
لا يُقصد بالمعلومات والمنشورات أن تكون، أو تشكل، أي نصيحة مالية أو استثمارية أو تجارية أو أنواع أخرى من النصائح أو التوصيات المقدمة أو المعتمدة من TradingView. اقرأ المزيد في شروط الاستخدام.