
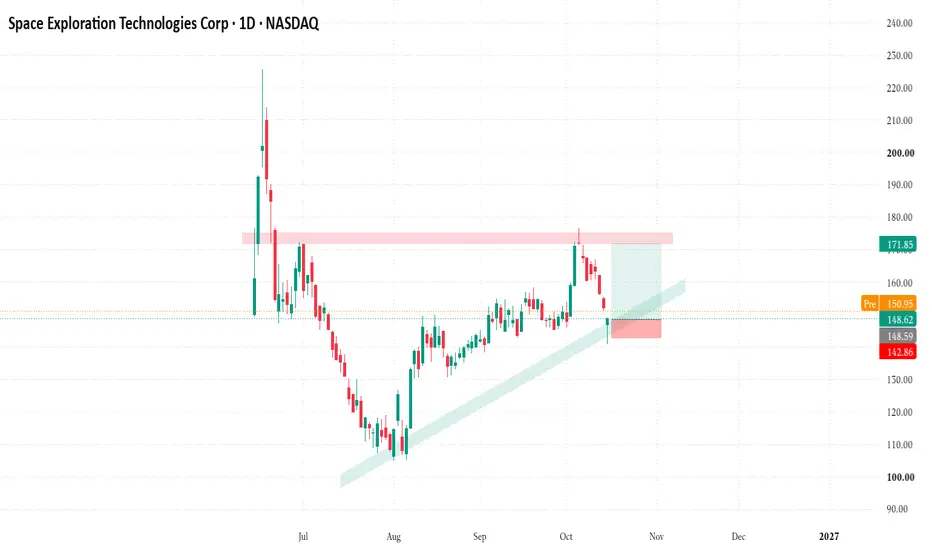
SPCX (1D) – Technical Analysis
SPCX is currently trading near $148.62 and testing an important support area.
Key Support Zone: $142.86–$148.60
Major Resistance Zone: $171–$175
Trend Structure: Ascending trendline with higher lows.
Bullish Scenario:
If the price holds above the support zone and forms a strong bullish daily candle, a move toward $155–$160 may be possible. A breakout above this area could open the way toward $165 and the major resistance zone near $171–$175.
Bearish Scenario:
If the price closes below $142.86 on the daily timeframe, selling pressure may increase. Potential support areas to monitor are $135, $130, and $120.
Confirmation: Watch daily candle closes, trading volume, and price action around the trendline.
Risk Management: Wait for confirmation before entering a trade. Define your entry, stop-loss, and risk-to-reward ratio in advance.
This analysis presents potential scenarios, not guaranteed price targets. Always manage risk and conduct your own research.
#SPCX #TechnicalAnalysis #PriceAction #TradingView
SPCX is currently trading near $148.62 and testing an important support area.
Key Support Zone: $142.86–$148.60
Major Resistance Zone: $171–$175
Trend Structure: Ascending trendline with higher lows.
Bullish Scenario:
If the price holds above the support zone and forms a strong bullish daily candle, a move toward $155–$160 may be possible. A breakout above this area could open the way toward $165 and the major resistance zone near $171–$175.
Bearish Scenario:
If the price closes below $142.86 on the daily timeframe, selling pressure may increase. Potential support areas to monitor are $135, $130, and $120.
Confirmation: Watch daily candle closes, trading volume, and price action around the trendline.
Risk Management: Wait for confirmation before entering a trade. Define your entry, stop-loss, and risk-to-reward ratio in advance.
This analysis presents potential scenarios, not guaranteed price targets. Always manage risk and conduct your own research.
#SPCX #TechnicalAnalysis #PriceAction #TradingView

إخلاء المسؤولية
لا يُقصد بالمعلومات والمنشورات أن تكون، أو تشكل، أي نصيحة مالية أو استثمارية أو تجارية أو أنواع أخرى من النصائح أو التوصيات المقدمة أو المعتمدة من TradingView. اقرأ المزيد في شروط الاستخدام.
إخلاء المسؤولية
لا يُقصد بالمعلومات والمنشورات أن تكون، أو تشكل، أي نصيحة مالية أو استثمارية أو تجارية أو أنواع أخرى من النصائح أو التوصيات المقدمة أو المعتمدة من TradingView. اقرأ المزيد في شروط الاستخدام.