
Hi guys,
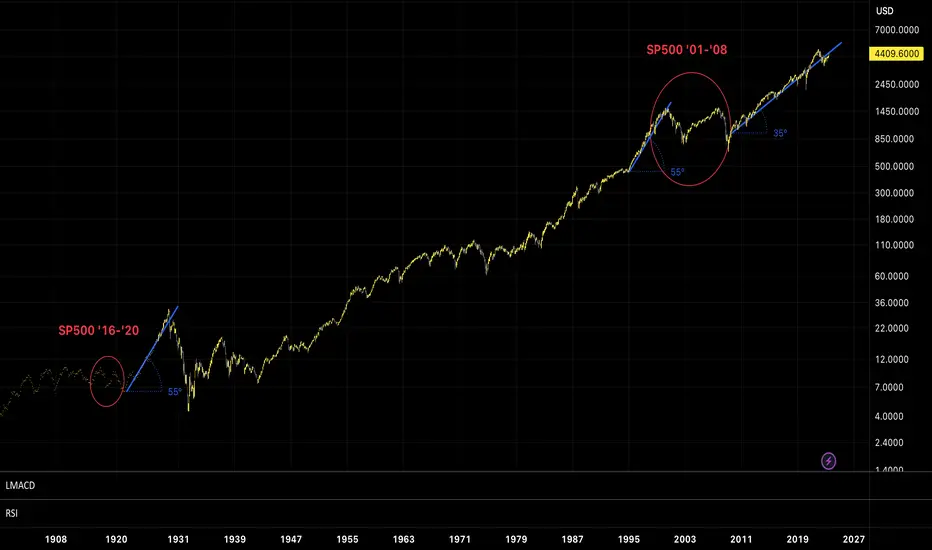
I saw a lot of fake guru comparing '16/'20 with todays'.
But in my mind is not true because if we compare '16/'20 with '01/'08 we all tend to agree the chart is so similar, but as u can see the rise after '08 crash is not in parabolic mode.
Could I'll be wrong? Of course, but if u find someone who compares chart randomly, unfollow immediately.
Let's see.
I saw a lot of fake guru comparing '16/'20 with todays'.
But in my mind is not true because if we compare '16/'20 with '01/'08 we all tend to agree the chart is so similar, but as u can see the rise after '08 crash is not in parabolic mode.
Could I'll be wrong? Of course, but if u find someone who compares chart randomly, unfollow immediately.
Let's see.

منشورات ذات صلة
إخلاء المسؤولية
لا يُقصد بالمعلومات والمنشورات أن تكون، أو تشكل، أي نصيحة مالية أو استثمارية أو تجارية أو أنواع أخرى من النصائح أو التوصيات المقدمة أو المعتمدة من TradingView. اقرأ المزيد في شروط الاستخدام.
منشورات ذات صلة
إخلاء المسؤولية
لا يُقصد بالمعلومات والمنشورات أن تكون، أو تشكل، أي نصيحة مالية أو استثمارية أو تجارية أو أنواع أخرى من النصائح أو التوصيات المقدمة أو المعتمدة من TradingView. اقرأ المزيد في شروط الاستخدام.