
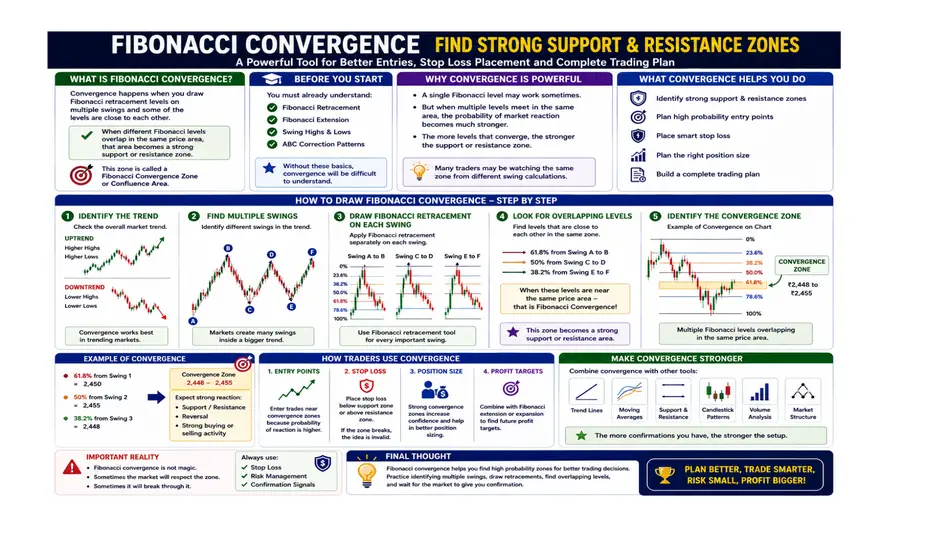
Understanding Fibonacci Convergence in Trading
*******************************
In the previous articles, we learned:
Day 01: Fibonacci Trading Tools
Day 02: Fibonacci Retracement Trading Strategy for Beginners
Day 03: Fibonacci Projection: Finding Exit Points in Trading
Today, we will learn one of the most powerful Fibonacci concepts:
Fibonacci Convergence
^^^^^^^^^^^^^^^^^^^^^^
This is one of the last major Fibonacci concepts beginners should learn before moving toward advanced trading techniques.
Fibonacci convergence helps traders:
Important Before Learning Fibonacci Convergence
^^^^^^^^^^^^^^^^^^^^^^
Before studying Fibonacci convergence, you should already understand:
Without understanding these basics, convergence may look confusing.
What Is Fibonacci Convergence?
*******************************
Market trends are built from many smaller swings inside one bigger trend.
Fibonacci convergence happens when:
When several Fibonacci levels meet near the same zone, that area becomes a stronger support or resistance level.
This area is called a:
Professional traders pay close attention to these zones because the market often reacts strongly there.
Why Fibonacci Convergence Is Powerful
*******************************
A single Fibonacci level may work sometimes.
But when:
appear near the same price area, the probability of market reaction becomes stronger.
This is because multiple traders may be watching the same area from different swing calculations.
The more Fibonacci levels that meet together, the stronger the support or resistance zone may become.
How to Draw Fibonacci Convergence
*******************************
Let’s learn step-by-step.
Step 1: Identify the Main Trend
^^^^^^^^^^^^^^^^^^^^^^
First, check whether the market is in:
Remember: Fibonacci convergence works best in trending markets.
Step 2: Find Multiple Swings
^^^^^^^^^^^^^^^^^^^^^^
Now identify different price swings on the chart.
For example:
The market usually creates many swings inside one trend.
Step 3: Draw Fibonacci Retracement Levels on Each Swing
^^^^^^^^^^^^^^^^^^^^^^
Apply Fibonacci retracement separately on every important swing.
For example:
Your chart may start looking crowded. That is normal.
Step 4: Look for Overlapping Levels
^^^^^^^^^^^^^^^^^^^^^^
Now carefully observe the retracement levels.
Suppose you see:
all located near the same price zone. This is Fibonacci convergence. That price area becomes an important support or resistance zone.
Example of Fibonacci Convergence
^^^^^^^^^^^^^^^^^^^^^^
Imagine this setup:
All these levels are very close.
So the zone between: $2,448 to $2,455
becomes a strong Fibonacci convergence area.
Traders may expect:
near that area.
How to Make Fibonacci Convergence Stronger
*******************************
Fibonacci convergence becomes more powerful when combined with:
Example:
If a convergence zone also matches: 200 Moving Average, Previous support zone and Bullish candlestick pattern then the setup may become much stronger.
Important: Fibonacci convergence is not magic. Sometimes the market will respect the zone. Sometimes it will break through it completely. That is why traders must always use: Stop losses, Risk management, and Confirmation signals
Never trade only because Fibonacci levels overlap.
*******************************
In the previous articles, we learned:
Day 01: Fibonacci Trading Tools
Day 02: Fibonacci Retracement Trading Strategy for Beginners
Day 03: Fibonacci Projection: Finding Exit Points in Trading
Today, we will learn one of the most powerful Fibonacci concepts:
Fibonacci Convergence
^^^^^^^^^^^^^^^^^^^^^^
This is one of the last major Fibonacci concepts beginners should learn before moving toward advanced trading techniques.
Fibonacci convergence helps traders:
- Identify strong support and resistance zones
- Plan entry and exit points
- Decide stop loss placement
- Manage position size
- Build a complete trading plan
Important Before Learning Fibonacci Convergence
^^^^^^^^^^^^^^^^^^^^^^
Before studying Fibonacci convergence, you should already understand:
- Fibonacci Retracement
- Fibonacci Extension
- Swing highs and swing lows
- ABC correction patterns
Without understanding these basics, convergence may look confusing.
What Is Fibonacci Convergence?
*******************************
Market trends are built from many smaller swings inside one bigger trend.
Fibonacci convergence happens when:
- You draw Fibonacci retracement levels on multiple swings, and
- Different Fibonacci levels appear close to each other in the same price area
When several Fibonacci levels meet near the same zone, that area becomes a stronger support or resistance level.
This area is called a:
- Fibonacci Convergence Zone
- Fibonacci Cluster
- Confluence Area
Professional traders pay close attention to these zones because the market often reacts strongly there.
Why Fibonacci Convergence Is Powerful
*******************************
A single Fibonacci level may work sometimes.
But when:
- 38.2% from one swing, and
- 61.8% from another swing
appear near the same price area, the probability of market reaction becomes stronger.
This is because multiple traders may be watching the same area from different swing calculations.
The more Fibonacci levels that meet together, the stronger the support or resistance zone may become.
How to Draw Fibonacci Convergence
*******************************
Let’s learn step-by-step.
Step 1: Identify the Main Trend
^^^^^^^^^^^^^^^^^^^^^^
First, check whether the market is in:
- An uptrend (Higher highs and higher lows)
- A downtrend (Lower highs and lower lows)
Remember: Fibonacci convergence works best in trending markets.
Step 2: Find Multiple Swings
^^^^^^^^^^^^^^^^^^^^^^
Now identify different price swings on the chart.
For example:
- Large swing: A → B
- Smaller swing inside the trend: C → D
- Another correction swing: E → F
The market usually creates many swings inside one trend.
Step 3: Draw Fibonacci Retracement Levels on Each Swing
^^^^^^^^^^^^^^^^^^^^^^
Apply Fibonacci retracement separately on every important swing.
For example:
- Draw Fibonacci from Swing A to B
- Draw another Fibonacci from Swing C to D
- Draw another Fibonacci from Swing E to F
Your chart may start looking crowded. That is normal.
Step 4: Look for Overlapping Levels
^^^^^^^^^^^^^^^^^^^^^^
Now carefully observe the retracement levels.
Suppose you see:
- 61.8% retracement from one swing
- 50% retracement from another swing
- 38.2% retracement from a third swing
all located near the same price zone. This is Fibonacci convergence. That price area becomes an important support or resistance zone.
Example of Fibonacci Convergence
^^^^^^^^^^^^^^^^^^^^^^
Imagine this setup:
- Swing 1 → 61.8% retracement at $2,450
- Swing 2 → 50% retracement at $2,455
- Swing 3 → 38.2% retracement at $2,448
All these levels are very close.
So the zone between: $2,448 to $2,455
becomes a strong Fibonacci convergence area.
Traders may expect:
- Price reversal
- Strong support
- Strong resistance
- Heavy buying or selling activity
near that area.
How to Make Fibonacci Convergence Stronger
*******************************
Fibonacci convergence becomes more powerful when combined with:
- Trend lines
- Moving averages
- Support and resistance
- Candlestick patterns
- Volume analysis
- Market structure
Example:
If a convergence zone also matches: 200 Moving Average, Previous support zone and Bullish candlestick pattern then the setup may become much stronger.
Fibonacci convergence is one of the most powerful concepts in Fibonacci trading.
Important: Fibonacci convergence is not magic. Sometimes the market will respect the zone. Sometimes it will break through it completely. That is why traders must always use: Stop losses, Risk management, and Confirmation signals
Never trade only because Fibonacci levels overlap.

منشورات ذات صلة
إخلاء المسؤولية
لا يُقصد بالمعلومات والمنشورات أن تكون، أو تشكل، أي نصيحة مالية أو استثمارية أو تجارية أو أنواع أخرى من النصائح أو التوصيات المقدمة أو المعتمدة من TradingView. اقرأ المزيد في شروط الاستخدام.
منشورات ذات صلة
إخلاء المسؤولية
لا يُقصد بالمعلومات والمنشورات أن تكون، أو تشكل، أي نصيحة مالية أو استثمارية أو تجارية أو أنواع أخرى من النصائح أو التوصيات المقدمة أو المعتمدة من TradingView. اقرأ المزيد في شروط الاستخدام.