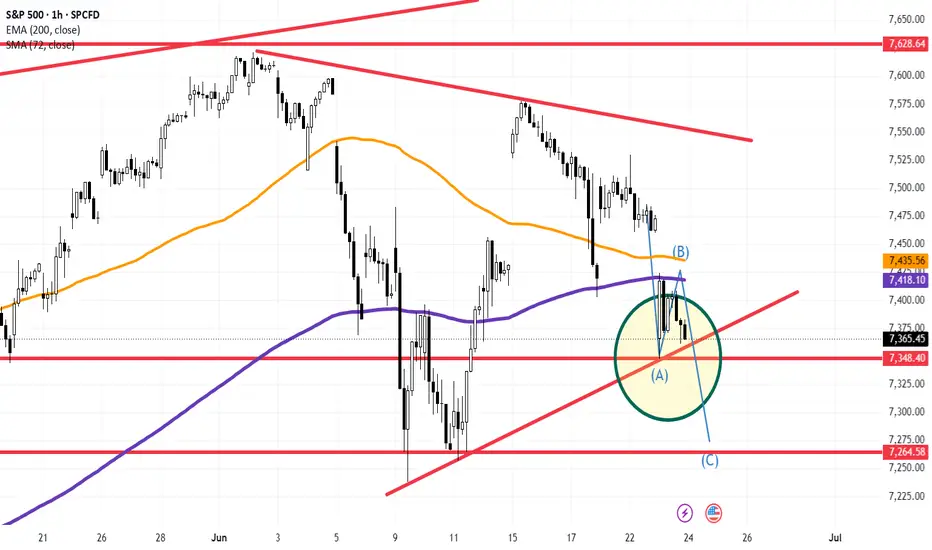
S&P 500 (SPX) 1H: Breaching $7,348 Trigger Zone Activates Corrective Wave C Target Near $7,264 Support
### 🇺🇸 S&P 500 Index (SPX) 1H Intraday Technical Structure (Ref: SPX_2026-06-24_08-41-11.png)
We are highlighting a critical tactical setup on the S&P 500 ( SPX - SPCFD) on the 1-Hour (1H) timeframe. The broader US equity market is flashing near-term structural distribution patterns, consolidating inside an explicit institutional inflection zone.
The index is currently printing slightly lower at **7,365.45 (-0.17%)**, compressing right above major diagonal support parameters.
---
### 🔍 Technical Breakdown & The ABC Corrective Framework:
1. **Dynamic Moving Average Resistance:** The index has cleanly broken below both the fast **72-period SMA (orange line at 7,435.56)** and the institutional **200-period EMA (purple line at 7,418.10)**. This shifting sequence converts these former floors into active supply clusters capping near-term relief bounces.
2. **The Inflection Node (Green Circle):** Price action is currently trapped in a tightening wedge formed by the descending corrective Wave (B) peak and the ascending primary **Line of Trend (LTA)** (lower red diagonal line).
---
### 🎯 The Bearish Trigger & Wave 3 / C Projections:
Our positional matrix details a highly systematic, two-tiered directional blueprint as the current compression nears its terminal breakout point:
* **The Primary Breakdown Trigger ($7,348.40):** The defining line of defense for buyers is locked at the horizontal static support floor plotted at **7,348.40** (intermediate horizontal red line). A clean hourly candle close below this level will invalidate the immediate local accumulation structure.
* **The Downside Extension Target ($7,264.58 Area):** Confirming the violation of the $7,348 baseline will unlock a direct momentum flush. Utilizing an Elliott Wave/expansion framework, this downward wave (marked as Wave C) projects a high-velocity extension towards the next major institutional demand zone established at **7,264.58** (thick lower horizontal red line). This cluster represents a massive historical support structural floor where aggressive buying absorption is anticipated.
### Tactical Strategy:
We maintain a defensive stance on near-term long exposure until clarity emerges. Momentum players will look for short setups upon a confirmed structural break of the **7,348** cluster, defining risk above the recent Wave (B) high. Conversely, swing traders should monitor the **7,264** region closely for potential high-asymmetry reversal candle patterns.
---
📊 **ChartPro Data**
*US Indices Architecture, Elliott Wave Corrective Mechanics & Systematic Trigger Routing.*
⚠️ **Disclaimer:** For educational and informational purposes only. This market update represents a personal trading framework and does not constitute financial or investment advice.
### 🇺🇸 S&P 500 Index (SPX) 1H Intraday Technical Structure (Ref: SPX_2026-06-24_08-41-11.png)
We are highlighting a critical tactical setup on the S&P 500 (
SPX - SPCFD) on the 1-Hour (1H) timeframe. The broader US equity market is flashing near-term structural distribution patterns, consolidating inside an explicit institutional inflection zone.The index is currently printing slightly lower at **7,365.45 (-0.17%)**, compressing right above major diagonal support parameters.
---
### 🔍 Technical Breakdown & The ABC Corrective Framework:
1. **Dynamic Moving Average Resistance:** The index has cleanly broken below both the fast **72-period SMA (orange line at 7,435.56)** and the institutional **200-period EMA (purple line at 7,418.10)**. This shifting sequence converts these former floors into active supply clusters capping near-term relief bounces.
2. **The Inflection Node (Green Circle):** Price action is currently trapped in a tightening wedge formed by the descending corrective Wave (B) peak and the ascending primary **Line of Trend (LTA)** (lower red diagonal line).
---
### 🎯 The Bearish Trigger & Wave 3 / C Projections:
Our positional matrix details a highly systematic, two-tiered directional blueprint as the current compression nears its terminal breakout point:
* **The Primary Breakdown Trigger ($7,348.40):** The defining line of defense for buyers is locked at the horizontal static support floor plotted at **7,348.40** (intermediate horizontal red line). A clean hourly candle close below this level will invalidate the immediate local accumulation structure.
* **The Downside Extension Target ($7,264.58 Area):** Confirming the violation of the $7,348 baseline will unlock a direct momentum flush. Utilizing an Elliott Wave/expansion framework, this downward wave (marked as Wave C) projects a high-velocity extension towards the next major institutional demand zone established at **7,264.58** (thick lower horizontal red line). This cluster represents a massive historical support structural floor where aggressive buying absorption is anticipated.
### Tactical Strategy:
We maintain a defensive stance on near-term long exposure until clarity emerges. Momentum players will look for short setups upon a confirmed structural break of the **7,348** cluster, defining risk above the recent Wave (B) high. Conversely, swing traders should monitor the **7,264** region closely for potential high-asymmetry reversal candle patterns.
---
📊 **ChartPro Data**
*US Indices Architecture, Elliott Wave Corrective Mechanics & Systematic Trigger Routing.*
⚠️ **Disclaimer:** For educational and informational purposes only. This market update represents a personal trading framework and does not constitute financial or investment advice.

إخلاء المسؤولية
لا يُقصد بالمعلومات والمنشورات أن تكون، أو تشكل، أي نصيحة مالية أو استثمارية أو تجارية أو أنواع أخرى من النصائح أو التوصيات المقدمة أو المعتمدة من TradingView. اقرأ المزيد في شروط الاستخدام.
إخلاء المسؤولية
لا يُقصد بالمعلومات والمنشورات أن تكون، أو تشكل، أي نصيحة مالية أو استثمارية أو تجارية أو أنواع أخرى من النصائح أو التوصيات المقدمة أو المعتمدة من TradingView. اقرأ المزيد في شروط الاستخدام.