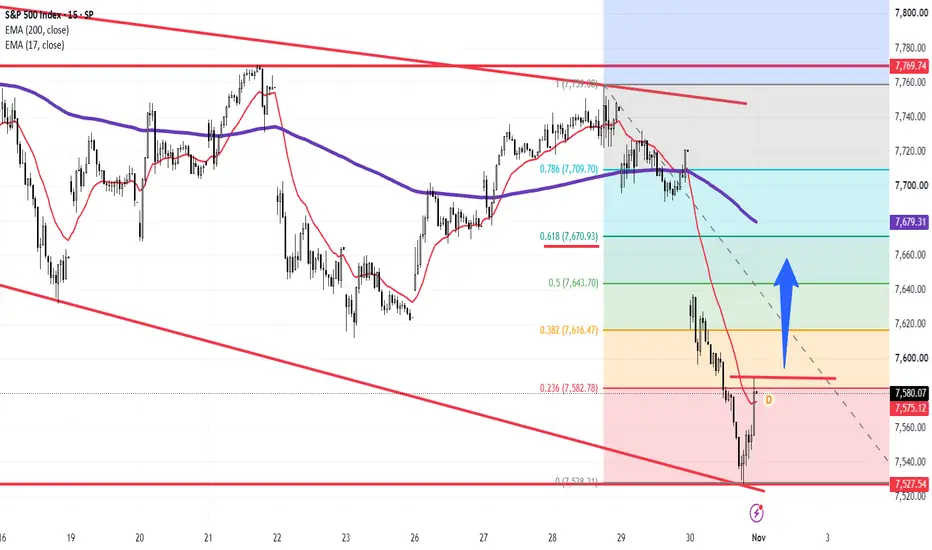
S&P 500 ( SPX) 15m Technical Matrix:
### 🇺🇸 S&P 500 ($SPCFD / SPX) 15-Minute Intraday Technical Matrix (Ref: SPX_2026-11-02_09-15-00.png)
We are issuing an updated 15-minute intraday technical study for the S&P 500 Index ($SPCFD) as November trading opens. Following a steep downside liquidation wave that drove prices directly into the macro ascending/descending channel support floor at **7,528.31**, price action has triggered an aggressive technical mean-reversion rebound.
The index is currently trading at **7,580.07 (-0.88%)**, having successfully reclaimed its trailing **17-EMA (7,575.12)** and pressing against the immediate **0.236 Fibonacci retracement barrier (7,582.78)**.
---
### 🔍 Technical Architecture & Level Roadmap:
1. **Immediate Demand Base & Swing Low Support:**
* **Macro Channel Floor / Fib 0.000:** **7,528.31** (red horizontal line / lower trendline) — Critical structural support zone where buyers absorbed heavy selling volume and established the recent intraday low.
2. **Fibonacci Recovery Target Grid (Impulse Vector - Blue Arrow):**
* **Immediate Dynamic Support (17-EMA):** **7,575.12** (red line) — Short-term dynamic floor currently protecting the recovery wave.
* **0.236 Retracement Level:** **7,582.78** (red dashed line) — Immediate breakout hurdle.
* **0.382 Retracement Node:** **7,616.47** — Intermediate supply target.
* **0.500 Retracement Level:** **7,643.70** — Mid-range equilibrium target.
* **0.618 Golden Pocket:** **7,670.93** — Major structural resistance zone.
* **0.786 Retracement Level:** **7,709.70** — Aligns near the **200-EMA (7,679.31)** and secondary overhead resistance.
* **1.000 Range Ceiling:** **7,759.08** — Major structural swing high.
---
### 🛡️ Strategic Operational Scenarios:
* **Scenario A — Bullish Mean-Reversion Bounce (Primary Expectation - Blue Arrow):** Sustained trading above the **17-EMA (7,575.12)** and a decisive 15m candle close above **7,582.78 (0.236 Fib)** confirms momentum continuation, opening a recovery vector toward **7,616.47 (0.382 Fib)** and **7,643.70 (0.500 Fib)**.
* **Scenario B — Rejection & Support Re-Test:** Failure to break above **7,582.78** combined with a loss of the **17-EMA (7,575.12)** exposes the index to a re-test of the lower channel base around **7,528.31**.
### 📊 Tactical Parameters Summary:
* **Current Bias:** Intraday Bullish Rebound / Technical Mean-Reversion
* **Execution Price:** 7,580.07[cite: 15]
* **Immediate Dynamic Support (17-EMA):** 7,575.12[cite: 15]
* **Immediate Resistance Pivot (0.236 Fib):** 7,582.78[cite: 15]
* **Primary Recovery Targets:** 7,616.47 (Fib 0.382) / 7,643.70 (Fib 0.500)
* **Structural Swing Low Base:** 7,528.31[cite: 15]
---
📊 **ChartPro Data**
*US Equity Index Intraday Architecture, Fibonacci Retracements & Systematic Risk Control.*
⚠️ **Disclaimer:** Educational study only. Not financial advice. Maintain disciplined position sizing and strict risk management protocols.
SPX) 15m Technical Matrix: ### 🇺🇸 S&P 500 ($SPCFD / SPX) 15-Minute Intraday Technical Matrix (Ref: SPX_2026-11-02_09-15-00.png)
We are issuing an updated 15-minute intraday technical study for the S&P 500 Index ($SPCFD) as November trading opens. Following a steep downside liquidation wave that drove prices directly into the macro ascending/descending channel support floor at **7,528.31**, price action has triggered an aggressive technical mean-reversion rebound.
The index is currently trading at **7,580.07 (-0.88%)**, having successfully reclaimed its trailing **17-EMA (7,575.12)** and pressing against the immediate **0.236 Fibonacci retracement barrier (7,582.78)**.
---
### 🔍 Technical Architecture & Level Roadmap:
1. **Immediate Demand Base & Swing Low Support:**
* **Macro Channel Floor / Fib 0.000:** **7,528.31** (red horizontal line / lower trendline) — Critical structural support zone where buyers absorbed heavy selling volume and established the recent intraday low.
2. **Fibonacci Recovery Target Grid (Impulse Vector - Blue Arrow):**
* **Immediate Dynamic Support (17-EMA):** **7,575.12** (red line) — Short-term dynamic floor currently protecting the recovery wave.
* **0.236 Retracement Level:** **7,582.78** (red dashed line) — Immediate breakout hurdle.
* **0.382 Retracement Node:** **7,616.47** — Intermediate supply target.
* **0.500 Retracement Level:** **7,643.70** — Mid-range equilibrium target.
* **0.618 Golden Pocket:** **7,670.93** — Major structural resistance zone.
* **0.786 Retracement Level:** **7,709.70** — Aligns near the **200-EMA (7,679.31)** and secondary overhead resistance.
* **1.000 Range Ceiling:** **7,759.08** — Major structural swing high.
---
### 🛡️ Strategic Operational Scenarios:
* **Scenario A — Bullish Mean-Reversion Bounce (Primary Expectation - Blue Arrow):** Sustained trading above the **17-EMA (7,575.12)** and a decisive 15m candle close above **7,582.78 (0.236 Fib)** confirms momentum continuation, opening a recovery vector toward **7,616.47 (0.382 Fib)** and **7,643.70 (0.500 Fib)**.
* **Scenario B — Rejection & Support Re-Test:** Failure to break above **7,582.78** combined with a loss of the **17-EMA (7,575.12)** exposes the index to a re-test of the lower channel base around **7,528.31**.
### 📊 Tactical Parameters Summary:
* **Current Bias:** Intraday Bullish Rebound / Technical Mean-Reversion
* **Execution Price:** 7,580.07[cite: 15]
* **Immediate Dynamic Support (17-EMA):** 7,575.12[cite: 15]
* **Immediate Resistance Pivot (0.236 Fib):** 7,582.78[cite: 15]
* **Primary Recovery Targets:** 7,616.47 (Fib 0.382) / 7,643.70 (Fib 0.500)
* **Structural Swing Low Base:** 7,528.31[cite: 15]
---
📊 **ChartPro Data**
*US Equity Index Intraday Architecture, Fibonacci Retracements & Systematic Risk Control.*
⚠️ **Disclaimer:** Educational study only. Not financial advice. Maintain disciplined position sizing and strict risk management protocols.

إخلاء المسؤولية
لا يُقصد بالمعلومات والمنشورات أن تكون، أو تشكل، أي نصيحة مالية أو استثمارية أو تجارية أو أنواع أخرى من النصائح أو التوصيات المقدمة أو المعتمدة من TradingView. اقرأ المزيد في شروط الاستخدام.
إخلاء المسؤولية
لا يُقصد بالمعلومات والمنشورات أن تكون، أو تشكل، أي نصيحة مالية أو استثمارية أو تجارية أو أنواع أخرى من النصائح أو التوصيات المقدمة أو المعتمدة من TradingView. اقرأ المزيد في شروط الاستخدام.