
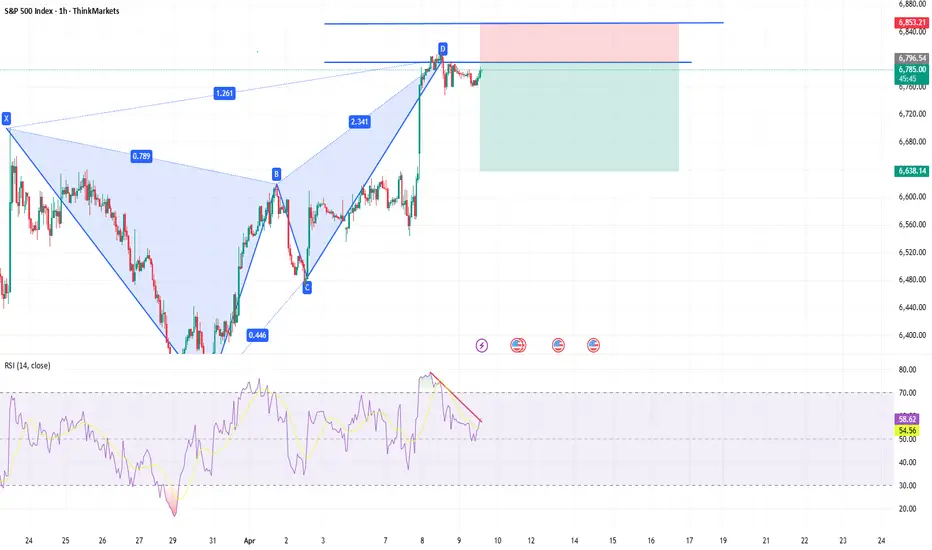
I’m watching a high-confluence short setup on SPX500 around the 6890 level, with multiple technical factors lining up for a potential rejection and continuation lower.
Entry Zone: 6890
Take Profit: 6620
• Bearish Butterfly Harmonic on H4 and M15
A bearish Butterfly pattern is completing on both the H4 and M15 timeframes, creating a strong potential reversal zone right around 6890. When the same harmonic structure appears across multiple timeframes, the setup carries more weight.
• Overbought Conditions from M15 to H4
Momentum looks stretched across all key lower and mid timeframes. From M15 up to H4, price is trading in overbought territory, which suggests buyers may be running out of strength after an aggressive push higher.
• Triple Top Formation on M15 to H1
On the lower timeframes, price is printing a triple top structure, which often signals exhaustion at resistance. Repeated failure to break higher is a warning sign that bullish momentum is weakening.
• Bearish RSI Divergence
RSI divergence is also visible from M15 to H1. Price is testing or matching highs, but RSI is making weaker highs, which confirms fading momentum and supports the case for a reversal.
• Previous Day High Acting as Resistance
Price is reacting around the previous day’s high, which is an important technical level and common liquidity zone. This area often acts as resistance, especially when price sweeps above or taps into it and fails to hold.
• Daily Trend Still Bearish
This short setup is not counter-trend. It is in line with the broader daily direction, as the market still appears to be moving within a larger bearish structure following recent macro-driven weakness. Selling rallies into resistance makes more sense while the higher timeframe trend remains down.
• Confluence at a Premium Price Area
Price is reaching a premium zone after an extended move up, which adds more reason to look for shorts rather than chasing longs. When price is overextended into resistance during a bearish higher timeframe trend, reversal setups become much more attractive.
• Possible Liquidity Grab Scenario
This area may also represent a liquidity sweep above local highs before a move lower. The triple top and previous day high together make this a natural place for stops to sit, and that increases the chance of a rejection once liquidity is taken.
Entry Zone: 6890
Take Profit: 6620
• Bearish Butterfly Harmonic on H4 and M15
A bearish Butterfly pattern is completing on both the H4 and M15 timeframes, creating a strong potential reversal zone right around 6890. When the same harmonic structure appears across multiple timeframes, the setup carries more weight.
• Overbought Conditions from M15 to H4
Momentum looks stretched across all key lower and mid timeframes. From M15 up to H4, price is trading in overbought territory, which suggests buyers may be running out of strength after an aggressive push higher.
• Triple Top Formation on M15 to H1
On the lower timeframes, price is printing a triple top structure, which often signals exhaustion at resistance. Repeated failure to break higher is a warning sign that bullish momentum is weakening.
• Bearish RSI Divergence
RSI divergence is also visible from M15 to H1. Price is testing or matching highs, but RSI is making weaker highs, which confirms fading momentum and supports the case for a reversal.
• Previous Day High Acting as Resistance
Price is reacting around the previous day’s high, which is an important technical level and common liquidity zone. This area often acts as resistance, especially when price sweeps above or taps into it and fails to hold.
• Daily Trend Still Bearish
This short setup is not counter-trend. It is in line with the broader daily direction, as the market still appears to be moving within a larger bearish structure following recent macro-driven weakness. Selling rallies into resistance makes more sense while the higher timeframe trend remains down.
• Confluence at a Premium Price Area
Price is reaching a premium zone after an extended move up, which adds more reason to look for shorts rather than chasing longs. When price is overextended into resistance during a bearish higher timeframe trend, reversal setups become much more attractive.
• Possible Liquidity Grab Scenario
This area may also represent a liquidity sweep above local highs before a move lower. The triple top and previous day high together make this a natural place for stops to sit, and that increases the chance of a rejection once liquidity is taken.

إخلاء المسؤولية
لا يُقصد بالمعلومات والمنشورات أن تكون، أو تشكل، أي نصيحة مالية أو استثمارية أو تجارية أو أنواع أخرى من النصائح أو التوصيات المقدمة أو المعتمدة من TradingView. اقرأ المزيد في شروط الاستخدام.
إخلاء المسؤولية
لا يُقصد بالمعلومات والمنشورات أن تكون، أو تشكل، أي نصيحة مالية أو استثمارية أو تجارية أو أنواع أخرى من النصائح أو التوصيات المقدمة أو المعتمدة من TradingView. اقرأ المزيد في شروط الاستخدام.